7-E 2002 track
Autor/Urheber:
Shortlink:
Quelle:
Größe:
2700 x 1669 Pixel (805741 Bytes)
Beschreibung:
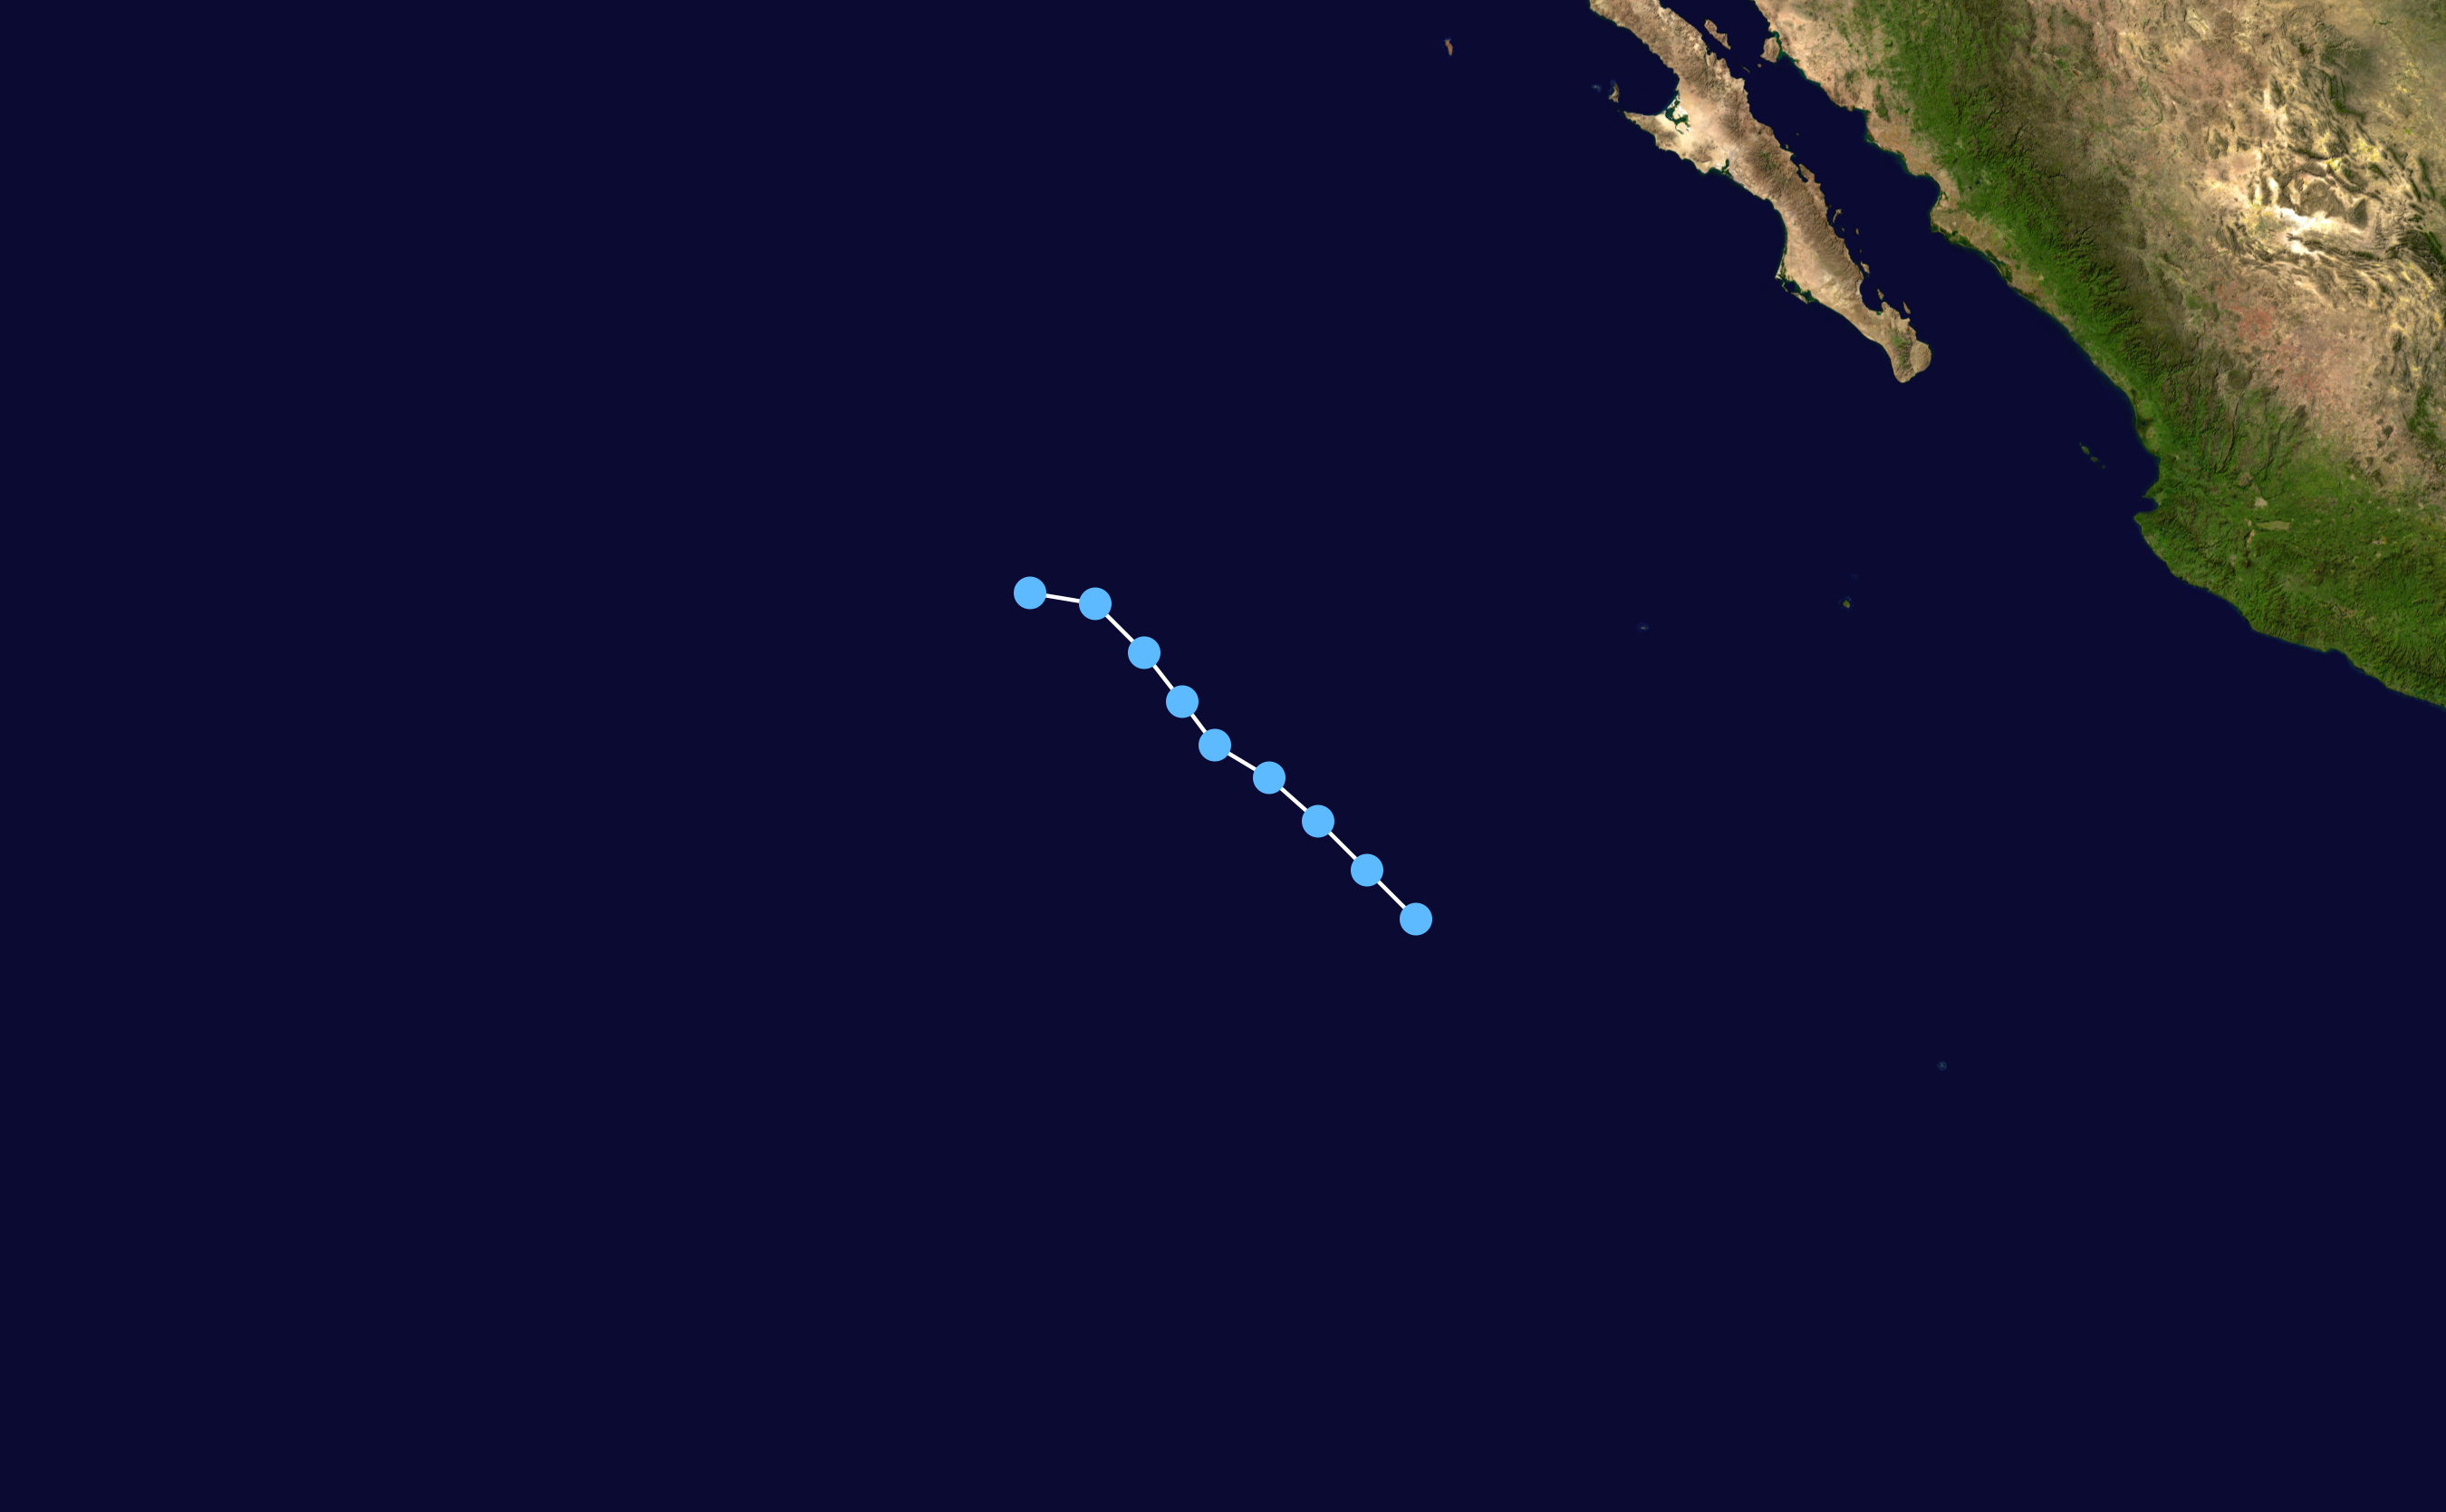
Track map of Tropical Depression Seven-E of the 2002 Pacific hurricane season. The points show the location of the storm at 6-hour intervals. The colour represents the storm's maximum sustained wind speeds as classified in the Saffir–Simpson scale (see below), and the shape of the data points represent the nature of the storm, according to the legend below.
 Extratropical cyclone / Remnant low / Tropical disturbance / Monsoon depression
Tropical depression (≤38 mph, ≤62 km/h)
Tropical storm (39–73 mph, 63–118 km/h)
Category 1 (74–95 mph, 119–153 km/h)
Category 2 (96–110 mph, 154–177 km/h)
Category 3 (111–129 mph, 178–208 km/h)
Category 4 (130–156 mph, 209–251 km/h)
Category 5 (≥157 mph, ≥252 km/h)
Unknown
Storm type
Lizenz:
Public domain
Credit:
Created by Nilfanion using WikiProject Tropical cyclones/Tracks. The background image is from NASA. Tracking data is from the National Hurricane Center[1].
Bild teilen:


Relevante Bilder


Relevante Artikel
Pazifische Hurrikansaison 2002Die Pazifische Hurrikansaison 2002 startete offiziell am 15. Mai 2002 im östlichen Pazifik und am 1. Juni 2002 im zentralen Pazifik und dauerte bis zum 30. November 2002. Diese Daten begrenzen konventionell den Abschnitt des Jahres, in dem sich im nordöstlichen Pazifik die meisten tropischen Wirbelstürme bilden. .. weiterlesen