Pazifische Hurrikansaison 2002
 Alle Stürme der Saison | |
| Bildung des ersten Sturms | 24. Mai |
|---|---|
| Auflösung des letzten Sturms | 16. November |
| Stärkster Sturm | Kenna – 913 hPa (mbar), 145 kn (269 km/h) |
| Tropische Tiefs | 19 |
| Stürme | 15 |
| Hurrikane | 8 |
| Schwere Hurrikane (Kat. 3+) | 6 |
| Opferzahl gesamt | 4 |
| Gesamtschaden | 101 Millionen $ (2002) |
| Pazifische Hurrikansaison 2000, 2001, 2002, 2003, 2004 | |
Die Pazifische Hurrikansaison 2002 startete offiziell am 15. Mai 2002 im östlichen Pazifik und am 1. Juni 2002 im zentralen Pazifik und dauerte bis zum 30. November 2002. Diese Daten begrenzen konventionell den Abschnitt des Jahres, in dem sich im nordöstlichen Pazifik die meisten tropischen Wirbelstürme bilden.
Stürme
Hurrikan Alma
| Kategorie-3-Hurrikan | |||
|---|---|---|---|
| |||
| Dauer | 24. Mai – 1. Juni | ||
| Intensität | 100 kn (185 km/h) (1-minütig), 960 hPa | ||
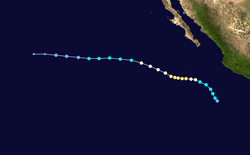
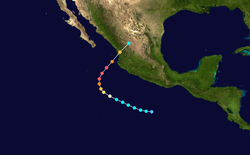
Am 24. Mai bildete sich im Golf von Tehuantepec eine tropische Welle, die am gleichen Tag als tropisches Tiefdruckgebiet Eins-E klassifiziert wurde. Es verstärkte sich langsam zwei Tage später in einen tropischen Sturm und bekam den Namen Alma. Der Sturm zog Richtung Norden und bewegte sich in der Nähe eines subtropischen Rückens über Mexiko. Alma verstärkte sich am 28. Mai zu einem Hurrikan, und nur zwei Tage später, am 30. Mai zu einem Major-Hurrikan der Kategorie 3. Aufgrund starker Windscherung und kühlem Wasser schwächte sich Alma am 1. Juni ab und degenerierte wieder zu einer tropischen Welle.
Alma war einer der frühesten Major-Hurrikane im Ostpazifik, und der zweitstärkste Mai-Hurrikan. Der andere stärkere Major-Hurrikan war der Hurrikan Adolph im Mai 2001.
Tropischer Sturm Boris
| Tropischer Sturm | |||
|---|---|---|---|
| |||
| Dauer | 8. Juni – 11. Juni | ||
| Intensität | 50 kn (95 km/h) (1-minütig), 997 hPa | ||
Tropisches Tiefdruckgebiet Drei-E
| Tropisches Tiefdruckgebiet | |||
|---|---|---|---|
| |||
| Dauer | 27. Juni – 29. Juni | ||
| Intensität | 30 kn (55 km/h) (1-minütig), 1006 hPa | ||
Tropischer Sturm Cristina
| Tropischer Sturm | |||
|---|---|---|---|
| |||
| Dauer | 9. Juli – 16. Juli | ||
| Intensität | 55 kn (100 km/h) (1-minütig), 994 hPa | ||
Hurrikan Douglas
| Kategorie-2-Hurrikan | |||
|---|---|---|---|
| |||
| Dauer | 20. Juli – 26. Juli | ||
| Intensität | 90 kn (165 km/h) (1-minütig), 970 hPa | ||
Am 20. Juli bildete sich eine tropische Welle, die am selben Tag als tropisches Tiefdruckgebiet Fünf-E klassifiziert wurde. Das Tiefdruckgebiet verstärkte sich rapide in einen tropischen Sturm, der sich erst nach Norden, dann nach Westen, und schließlich nach Nordwesten bewegte. Am 22. Juli verstärkte sich Douglas in einen Hurrikan und erreichte seinen Höhepunkt mit Windgeschwindigkeiten von 165 km/h in der Kategorie 2 am nächsten Tag. Der Sturm begann sich danach zu schwächen, da er über kühlere Gewässer zog und eine Eyewall-Neubildung durchführte. Am 24. Juli schwächte sich Douglas erst zu einem tropischen Sturm, und später am Tag zu einem tropischen Tiefdruckgebiet ab. Zwei Tage später degenerierte das System wieder zu einer tropischen Welle.
Hurrikan Elida
| Kategorie-5-Hurrikan | |||
|---|---|---|---|
| |||
| Dauer | 23. Juli – 30. Juli | ||
| Intensität | 140 kn (260 km/h) (1-minütig), 921 hPa | ||
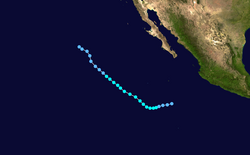
Am 23. Juli generierte sich eine tropische Welle in das Tropische Tiefdruckgebiet Sechs-E. Es bewegte sich Richtung Westen und erreichte nur 12 Stunden nach seiner Bildung Sturmstärke. Elida verstärkte sich rapide und wurde am 24. Juli ein Hurrikan und nur 6 Stunden später ein Major-Hurrikan. Der Hurrikan setzte seine rasche Intensivierung fort und verstärkte sich am 25. Juli für 6 Stunden zu einem Hurrikan der Kategorie 5, dem ersten Kategorie-5-Hurrikan seit Linda im Jahr 1997. Trotz wärmerer Gewässer begann Elida sich wegen einer Zyklischen Eyewall-Neubildung abzuschwächen, sodass das System am 27. Juli nur noch ein tropischer Sturm war und später zu einem Resttief degenerierte. Das Resttief löste sich über dem offenen Ozean etwa 860 km westlich von Los Angeles auf.
Elida erlebte eine der schnellsten Intensivierungen im östlichen Pazifik zu einem Hurrikan. Nur Linda im Jahr 1997 intensivierte sich schneller. Elida hatte keine direkten Auswirkungen aufs Land. Allerdings sorgte sie für schwere Wellen entlang der Küste Mexikos. Niemand wurde getötet und es gab auch keine Schäden.
Tropisches Tiefdruckgebiet Sieben-E
| Tropisches Tiefdruckgebiet | |||
|---|---|---|---|
| |||
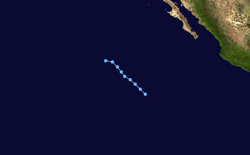
| Dauer | 6. August – 8. August | ||
| Intensität | 30 kn (55 km/h) (1-minütig), 1008 hPa | ||
Hurrikan Fausto
| Kategorie-4-Hurrikan | |||
|---|---|---|---|
| |||
| Dauer | 21. August – 3. September | ||
| Intensität | 125 kn (230 km/h) (1-minütig), 936 hPa | ||
Tropischer Sturm Alika
| Tropischer Sturm | |||
|---|---|---|---|
| |||
| Dauer | 22. August – 28. August | ||
| Intensität | 55 kn (100 km/h) (1-minütig), 995 hPa | ||
Tropischer Sturm Genevieve
| Tropischer Sturm | |||
|---|---|---|---|
| |||
| Dauer | 26. August – 1. September | ||
| Intensität | 60 kn (110 km/h) (1-minütig), 989 hPa | ||
Hurrikan Ele
| Kategorie-4-Hurrikan | |||
|---|---|---|---|
| |||
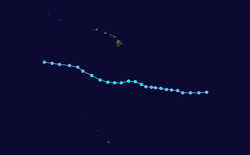
| Dauer | 27. August – 30. August (→ Westpazifik) | ||
| Intensität | 115 kn (215 km/h) (1-minütig), 945 hPa | ||
Hurrikan Hernan
| Kategorie-5-Hurrikan | |||
|---|---|---|---|
| |||
| Dauer | 30. August – 6. September | ||
| Intensität | 140 kn (260 km/h) (1-minütig), 921 hPa | ||
Tropisches Tiefdruckgebiet Elf-E
| Tropisches Tiefdruckgebiet | |||
|---|---|---|---|
| |||
| Dauer | 5. September – 8. September | ||
| Intensität | 30 kn (55 km/h) (1-minütig), 1006 hPa | ||
Tropischer Sturm Iselle
| Tropischer Sturm | |||
|---|---|---|---|
| |||
| Dauer | 15. September – 20. September | ||
| Intensität | 60 kn (110 km/h) (1-minütig), 990 hPa | ||
Tropischer Sturm Julio
| Tropischer Sturm | |||
|---|---|---|---|
| |||
| Dauer | 25. September – 26. September | ||
| Intensität | 40 kn (75 km/h) (1-minütig), 1000 hPa | ||
Hurrikan Kenna
| Kategorie-5-Hurrikan | |||
|---|---|---|---|
| |||
| Dauer | 22. Oktober – 26. Oktober | ||
| Intensität | 145 kn (270 km/h) (1-minütig), 913 hPa | ||
- → Hauptartikel: Hurrikan Kenna (2002)
Tropischer Sturm Lowell
| Tropischer Sturm | |||
|---|---|---|---|
| |||
| Dauer | 22. Oktober – 31. Oktober | ||
| Intensität | 45 kn (85 km/h) (1-minütig), 1002 hPa | ||
Hurrikan Huko
| Kategorie-1-Hurrikan | |||
|---|---|---|---|
| |||
| Dauer | 24. Oktober – 3. November | ||
| Intensität | 75 kn (140 km/h) (1-minütig), 980 hPa | ||
Tropisches Tiefdruckgebiet Sechzehn-E
| Tropisches Tiefdruckgebiet | |||
|---|---|---|---|
| |||
| Dauer | 14. November – 16. November | ||
| Intensität | 30 kn (55 km/h) (1-minütig), 1006 hPa | ||
Saisonübersicht
Sturmnamen
Die folgenden Namen wurden für benannte Stürme benutzt: Die folgenden Namen wurden für benannte Stürme benutzt:
- Alma, Boris, Cristina, Douglas, Elida, Fausto, Genevieve, Hernan, Iselle, Julio, Kenna, Lowell
Nicht mehr zur Anwendung kamen:
- Marie, Norbert, Odile, Polo, Rachel, Simon, Trudy, Vance, Winnie, Xavier, Yolanda, Zeke
Stürme, die sich zwischen der Datumsgrenze (180° westlicher Länge) und 140° westlicher Länge bilden, erhalten ihren Namen aufgrund einer gesonderten Liste. Diese Liste wird nicht jedes Jahr gewechselt, sondern die Namen werden der Reihe nach verwendet.
Siehe auch
Weblinks
Auf dieser Seite verwendete Medien
Track map of Tropical Storm Cristina of the 2002 Pacific hurricane season. The points show the location of the storm at 6-hour intervals. The colour represents the storm's maximum sustained wind speeds as classified in the (see below), and the shape of the data points represent the nature of the storm, according to the legend below.
Storm type
As of Thursday morning, May 30, 2002, Hurricane Alma was a Category 2 hurricane, with sustained winds up to 110 miles per hour and gusts up to 135 miles per hour. Located in the eastern Pacific Ocean several hundred miles west of central Mexico and south of Baja California, the storm is tracking northward at about 9 miles per hour, and is forecast to weaken as it moves north over cooler ocean waters. Alma is the eastern Pacific's first named storm of the season. This image of Hurricane Alma was captured by the Moderate Resolution Imaging Spectroradiometer (MODIS) on the Terra satellite on Wednesday, May 29, 2002.
Track map of Tropical Storm Boris of the 2002 Pacific hurricane season. The points show the location of the storm at 6-hour intervals. The colour represents the storm's maximum sustained wind speeds as classified in the (see below), and the shape of the data points represent the nature of the storm, according to the legend below.
Storm type
Hurricane Elida near maximum strength in eastern Pacific - NOAA-15 image - July 25
Tropical Storm Agatha of the 2010 Pacific hurricane season on May 29, 2010 soon after being upgraded to a tropical storm.
This image shows Tropical Storm Genevieve in the Pacific Ocean at 2055 UTC on August 28, 2002. The storm's maximum sustained wind speeds were about 70 mph and the minimum pressure was approximately 989 mb.
Track map of Tropical Storm Lowell of the 2002 Pacific hurricane season. The points show the location of the storm at 6-hour intervals. The colour represents the storm's maximum sustained wind speeds as classified in the (see below), and the shape of the data points represent the nature of the storm, according to the legend below.
Storm type
Tropical Depression Thirteen-E (Julio) was located over the Pacific Ocean near 16.2N 101.9W at 15:00 UTC. Thirteen-E was moving northward at 3 knots with maximum sustained winds estimated at 30 knots, gusts to 40 knots. It would soon become Tropical Storm Julio.
Track map of Hurricane Kenna of the 2002 Pacific hurricane season. The points show the location of the storm at 6-hour intervals. The colour represents the storm's maximum sustained wind speeds as classified in the (see below), and the shape of the data points represent the nature of the storm, according to the legend below.
Storm type
Track map of Tropical Storm Genevieve of the 2002 Pacific hurricane season. The points show the location of the storm at 6-hour intervals. The colour represents the storm's maximum sustained wind speeds as classified in the (see below), and the shape of the data points represent the nature of the storm, according to the legend below.
Storm type
As recently as July 23, 2002, Hurricane Douglas was a Category 2 hurricane, with winds as high as 90 knots (over 100 miles per hour). As of July 24, Douglas had dropped back to Category 1 status as it moved away from the Baja California Peninsula (seen at upper right) in the eastern Pacific Ocean. The storm is predicted to continue moving westward over the next 24 hours and should weaken as it moves over cooler waters. This image was acquired by the Moderate Resolution Imaging Spectroradiometer (MODIS) on the Terra satellite on July 23, 2002.
Track map of Hurricane Fausto of the 2002 Pacific hurricane season. The points show the location of the storm at 6-hour intervals. The colour represents the storm's maximum sustained wind speeds as classified in the (see below), and the shape of the data points represent the nature of the storm, according to the legend below.
Storm type
Now downgraded to a tropical depression, Tropical Storm Cristina can be seen at full strength in this true-color image taken on July 14, 2002, by the Moderate Resolution Imaging Spectroradiometer (MODIS), flying aboard NASA's Terra spacecraft. The land in the upper right-hand corner is Baja California.
The typhoon, which formed to the south a few days ago, moved northward and headed toward Baja California before turning west and dissipating in the eastern Pacific. When this image was taken, the tropical storm bore sustained winds of over 63 kilometers (39 miles) per hour. Currently, sustained winds are at 46 kilometers (28 miles) per hour.Track map of Tropical Storm Alika of the 2002 Pacific hurricane season. The points show the location of the storm at 6-hour intervals. The colour represents the storm's maximum sustained wind speeds as classified in the (see below), and the shape of the data points represent the nature of the storm, according to the legend below.
Storm type
Tropical Storm Alika near peak intensity on August 25 at 2005 UTC. To the southwest of Alika is a disturbance that would soon become Tropical Depression 2C, and later Hurricane Ele. This image was produced from data from NOAA-17, provided by NOAA. The storm's maximum sustained winds were 60 mph.
Track map of Tropical Storm Iselle of the 2002 Pacific hurricane season. The points show the location of the storm at 6-hour intervals. The colour represents the storm's maximum sustained wind speeds as classified in the (see below), and the shape of the data points represent the nature of the storm, according to the legend below.
Storm type
This image shows Tropical Storm Lowell in the Pacific Ocean at 2145 UTC on October 23, 2002. The storm's maximum sustained wind speeds were about 45 mph and the minimum pressure was approximately 1003 mb.
Track map of Hurricane Elida of the 2002 Pacific hurricane season. The points show the location of the storm at 6-hour intervals. The colour represents the storm's maximum sustained wind speeds as classified in the (see below), and the shape of the data points represent the nature of the storm, according to the legend below.
Storm type
This image of Tropical Depression 7E was captured by the GOES-10 satellite on August 6, 2002 at 1630 UTC. 7E was located in the Pacific Ocean with peak intensity winds of 35 mph and a minimum pressure of 1008 mb.
This true-color image of Hurricane Fausto was acquired August 24, 2002 by the Aqua MODIS instrument. Fausto started out on August 21st as a tropical depression, but later that same day was upgraded to a tropical storm. Less than 24 hours later, Fausto officially became a hurricane. Fausto spent six days as a hurricane, from August 22 to 26, peaking on the 24th as a level four hurricane (as shown in this image) with winds of 125 knots (1 knot = 1.15 mph) and gusts of up to 150. Fausto whirled northwest throughout the eastern Pacific Ocean and caused waves between 13 and 18 feet in height. But by noon on the 26th, Fausto was downgraded to a tropical storm when its winds fell below 64 knots.
Track map of Tropical Storm Julio of the 2002 Pacific hurricane season. The points show the location of the storm at 6-hour intervals. The colour represents the storm's maximum sustained wind speeds as classified in the (see below), and the shape of the data points represent the nature of the storm, according to the legend below.
Storm type
Track map of Hurricane Alma of the 2002 Pacific hurricane season. The points show the location of the storm at 6-hour intervals. The colour represents the storm's maximum sustained wind speeds as classified in the (see below), and the shape of the data points represent the nature of the storm, according to the legend below.
Storm type
Tropical Storm Iselle was located over the Pacific Ocean near 21.7N 114.0W at 15:00 UTC. Iselle was moving northwestward at 11 knots with maximum sustained winds estimated at 55 knots, gusts to 65 knots.
Packing winds of 160 miles per hour (257 km per hour), Hurricane Kenna intensified into a Category 5 storm on Oct. 25, 2002. Kenna is shown in this true-color image bearing down on Mexico’s west coast.
This scene was acquired by the Moderate Resolution Imaging Spectroradiometer (MODIS), flying aboard NASA’s Terra satellite, on October 24. Category 5 hurricanes, the strongest category, are capable of causing catastrophic damage. The storm is predicted to make landfall by late morning on Oct. 25.Track map of Hurricane/Typhoon Ele of the 2002 Pacific hurricane season and the 2002 Pacific typhoon season. The points show the location of the storm at 6-hour intervals. The colour represents the storm's maximum sustained wind speeds as classified in the (see below), and the shape of the data points represent the nature of the storm, according to the legend below.
Storm type
This image of Tropical Depression 3E was captured by the GOES-10 satellite on June 28, 2002 at 0130 UTC. 3E was located in the Pacific Ocean with peak intensity winds of 35 mph and a minimum pressure of 1007 mb.
This image shows Tropical Depression 11E in the Pacific Ocean at 2050 UTC on August 6, 2002. The storm's maximum sustained wind speeds were about 35 mph and the minimum pressure was approximately 1007 mb.
This image shows Hurricane Huko in the Pacific Ocean at 2155 UTC on November 1, 2002. The storm's maximum sustained wind speeds were about 85 mph and the minimum pressure was approximately 980 mb.
Track map of Hurricane Douglas of the 2002 Pacific hurricane season. The points show the location of the storm at 6-hour intervals. The colour represents the storm's maximum sustained wind speeds as classified in the (see below), and the shape of the data points represent the nature of the storm, according to the legend below.
Storm type
Track map of Hurricane Huko of the 2002 Pacific hurricane season and the 2002 Pacific typhoon season. The points show the location of the storm at 6-hour intervals. The colour represents the storm's maximum sustained wind speeds as classified in the (see below), and the shape of the data points represent the nature of the storm, according to the legend below.
Storm type
This true-color image of Hurricane Hernan off of Baja California was captured on September 1, 2002, by the Moderate Resolution Imaging Spectroradiometer (MODIS), flying aboard NASA's Aqua spacecraft. Hernan peaked on Sunday, September 1 as a Category 5 hurricane with winds of 160 miles (260 kilometers). Hernan is the only hurricane to reach Category 5 status out of a total of six hurricanes to occur so far this season in the eastern Pacific.
This image shows Tropical Storm Boris in the Pacific Ocean at 1755 UTC on June 9, 2002. The storm's maximum sustained wind speeds were about 60 mph and the minimum pressure was approximately 1000 mb.
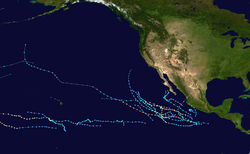
This map shows the tracks of all tropical cyclones in the 2002 Pacific hurricane season. The points show the location of each storm at 6-hour intervals. The colour represents the storm's maximum sustained wind speeds as classified in the Saffir-Simpson Hurricane Scale (see below), and the shape of the data points represent the type of the storm.
Track map of Tropical Depression Sixteen-E of the 2002 Pacific hurricane season. The points show the location of the storm at 6-hour intervals. The colour represents the storm's maximum sustained wind speeds as classified in the (see below), and the shape of the data points represent the nature of the storm, according to the legend below.
Storm type
Track map of Hurricane Hernan of the 2002 Pacific hurricane season. The points show the location of the storm at 6-hour intervals. The colour represents the storm's maximum sustained wind speeds as classified in the (see below), and the shape of the data points represent the nature of the storm, according to the legend below.
Storm type
Track map of Tropical Depression Seven-E of the 2002 Pacific hurricane season. The points show the location of the storm at 6-hour intervals. The colour represents the storm's maximum sustained wind speeds as classified in the (see below), and the shape of the data points represent the nature of the storm, according to the legend below.
Storm type
Track map of Tropical Depression Three-E of the 2002 Pacific hurricane season. The points show the location of the storm at 6-hour intervals. The colour represents the storm's maximum sustained wind speeds as classified in the (see below), and the shape of the data points represent the nature of the storm, according to the legend below.
Storm type
Hurricane Ele became Typhoon Ele as it crossed the International Date Line this past weekend. The typhoon/hurricane be seen in the central Pacific in this true-color image taken on August 30, 2002, by the Moderate Resolution Imaging Spectroradiometer (MODIS), flying aboard NASA's Terra spacecraft. As of September 3, the typhoon was several hundred miles east of the International Date Line and making its way north through the Pacific, packing sustained winds of up to 121 miles (195 kilometers) per hour.
Track map of Tropical Depression Eleven-E of the 2002 Pacific hurricane season. The points show the location of the storm at 6-hour intervals. The colour represents the storm's maximum sustained wind speeds as classified in the (see below), and the shape of the data points represent the nature of the storm, according to the legend below.
Storm type
This image of Tropical Depression 16E was captured by the GOES-10 satellite on November 14, 2002 at 2200 UTC. 16E was located in the Pacific Ocean with peak intensity winds of 35 mph and a minimum pressure of 1007 mb.


