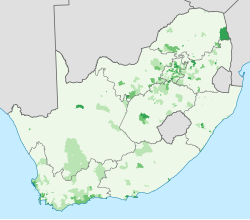
South Africa 2011 dominant language map
Autor/Urheber:
Shortlink:
Quelle:
Größe:
809 x 709 Pixel (817166 Bytes)
Beschreibung:
Map showing the dominant home languages in South Africa, based on ward-level data from the 2011 census. In this context, a language is dominant if it more than 50% of the population in a ward speak it at home, or more than 33% speak it and no other language is spoken by more than 25%.
English
Afrikaans
isiNdebele
isiXhosa
isiZulu
Sesotho sa Leboa
Sesotho
Setswana
siSwati
Tshivenda
Xitsonga
No language dominant
Projection is Albers Equal-Area Conic, with standard parallels at 25.5° S and 31.5° S, and origin at 28.5° S 24.5° E.
Lizenz:
Public domain
Credit:
Statistics South Africa's Census 2011 is the source of the basic population data. The map results from my own processing of the data. For ward boundaries see File:South Africa electoral wards 2011 blank.svg.
Relevante Bilder
Relevante Artikel
Demografie SüdafrikasDie Demografie Südafrikas ist sehr heterogen, das Land gilt als eines der ethnisch-demografisch vielfältigsten Länder des afrikanischen Kontinents. Südafrika ist die Heimat verschiedener afrikanischer Gesellschaften sowie der Nachfahren vorwiegend niederländischer, deutscher, französischer, asiatischer und britischer Einwanderer. Südafrika ist damit ein multikulturelles Land und wird oft als „Regenbogennation“ bezeichnet. .. weiterlesen


