Nida 2009 track
Autor/Urheber:
Shortlink:
Quelle:
Größe:
2700 x 1669 Pixel (495066 Bytes)
Beschreibung:
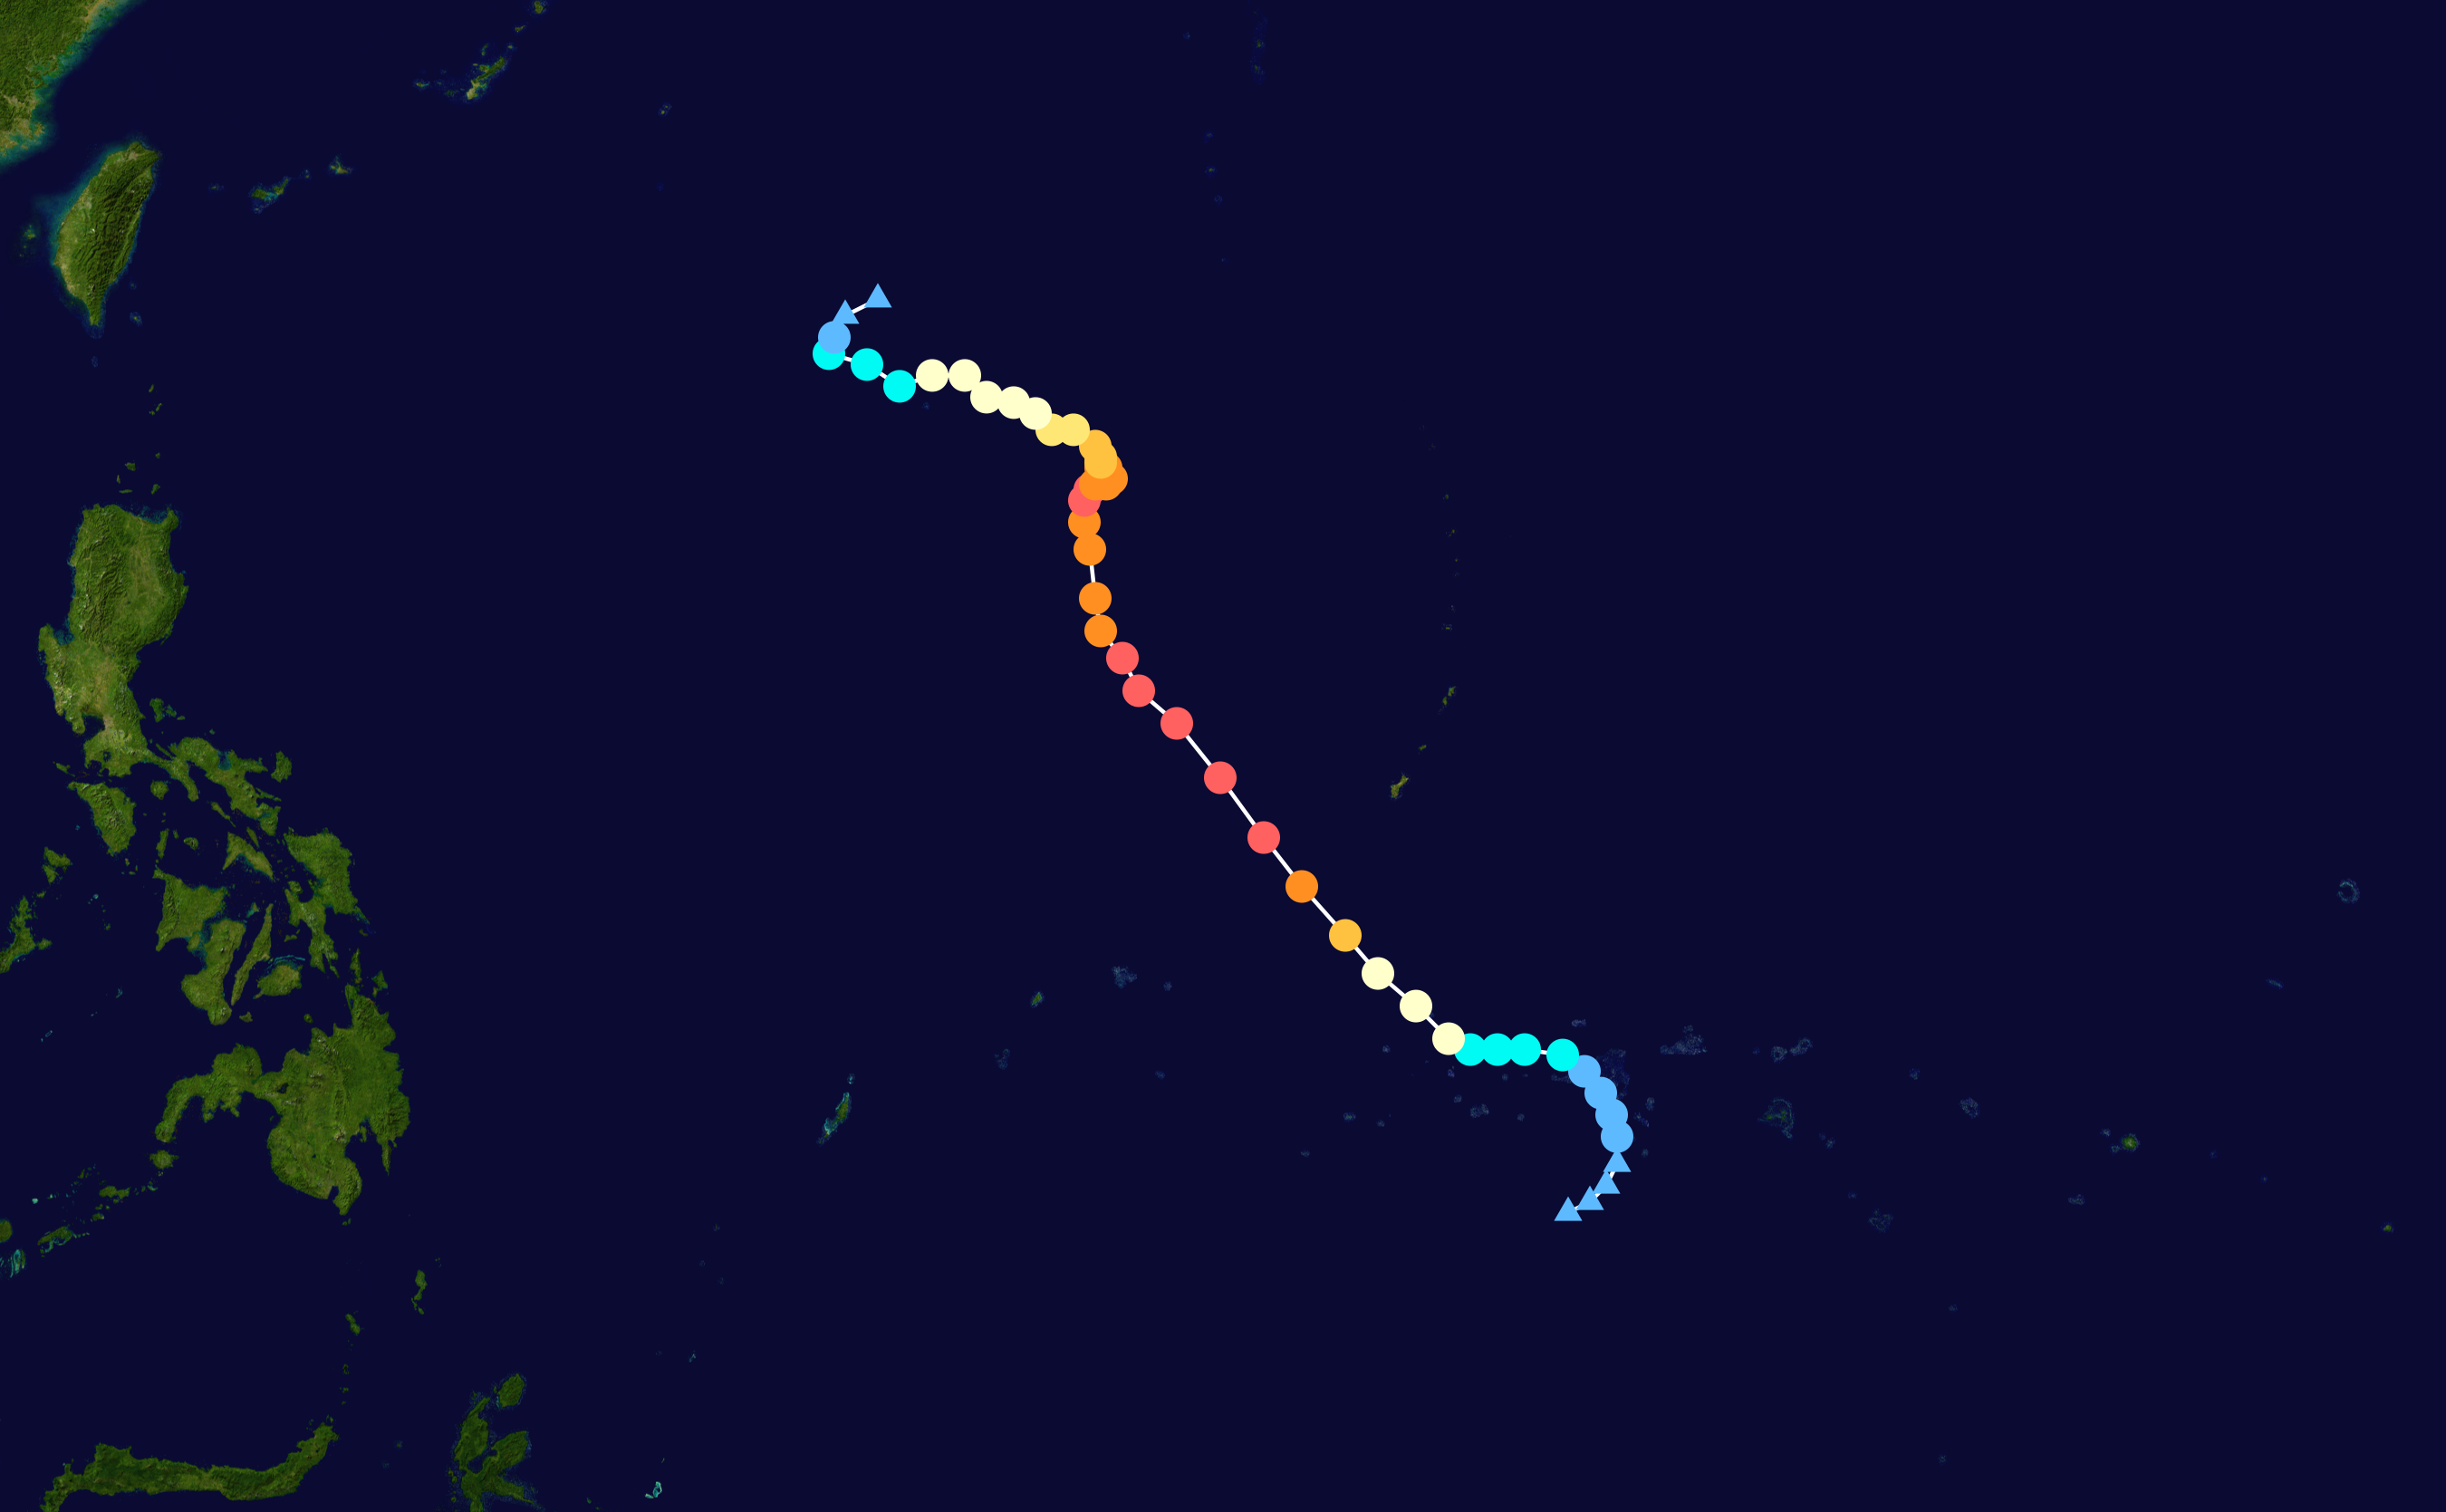
Track map of Typhoon Nida of the 2009 Pacific typhoon season. The points show the location of the storm at 6-hour intervals. The colour represents the storm's maximum sustained wind speeds as classified in the (see below), and the shape of the data points represent the nature of the storm, according to the legend below.
 Extratropical cyclone / Remnant low / Tropical disturbance / Monsoon depression
Tropical depression (≤38 mph, ≤62 km/h)
Tropical storm (39–73 mph, 63–118 km/h)
Category 1 (74–95 mph, 119–153 km/h)
Category 2 (96–110 mph, 154–177 km/h)
Category 3 (111–129 mph, 178–208 km/h)
Category 4 (130–156 mph, 209–251 km/h)
Category 5 (≥157 mph, ≥252 km/h)
Unknown
Storm type
Lizenz:
Public domain
Credit:
Created by Keith Edkins using Wikipedia:WikiProject Tropical cyclones/Tracks. The background image is from NASA. Tracking data is from the Joint Typhoon Warning Center[1].
Bild teilen:


Relevante Bilder


Relevante Artikel
Pazifische Taifunsaison 2009Die Pazifische Taifunsaison 2009 ist die Ansammlung der im Jahr 2009 im westlichen Pazifischen Ozean aufgetretenen tropischen Wirbelstürme. Im Gegensatz zum atlantischen Ozean und seinen Randmeeren hat die Taifunsaison keine offiziellen Grenzen, sondern ist mit dem Kalenderjahr identisch. Die meisten tropischen Wirbelstürme bilden sich hier jedoch zwischen Mai und November. Tropische Wirbelstürme, die sich nördlich des Äquators und westlich der Datumsgrenze bilden, nennt man Taifune. Die sich östlich des 180. Längengrades bildenden Stürme sind Gegenstand der Pazifischen Hurrikansaison 2009. .. weiterlesen