Magda 2010 track
Autor/Urheber:
Shortlink:
Quelle:
Größe:
2700 x 1669 Pixel (3820809 Bytes)
Beschreibung:
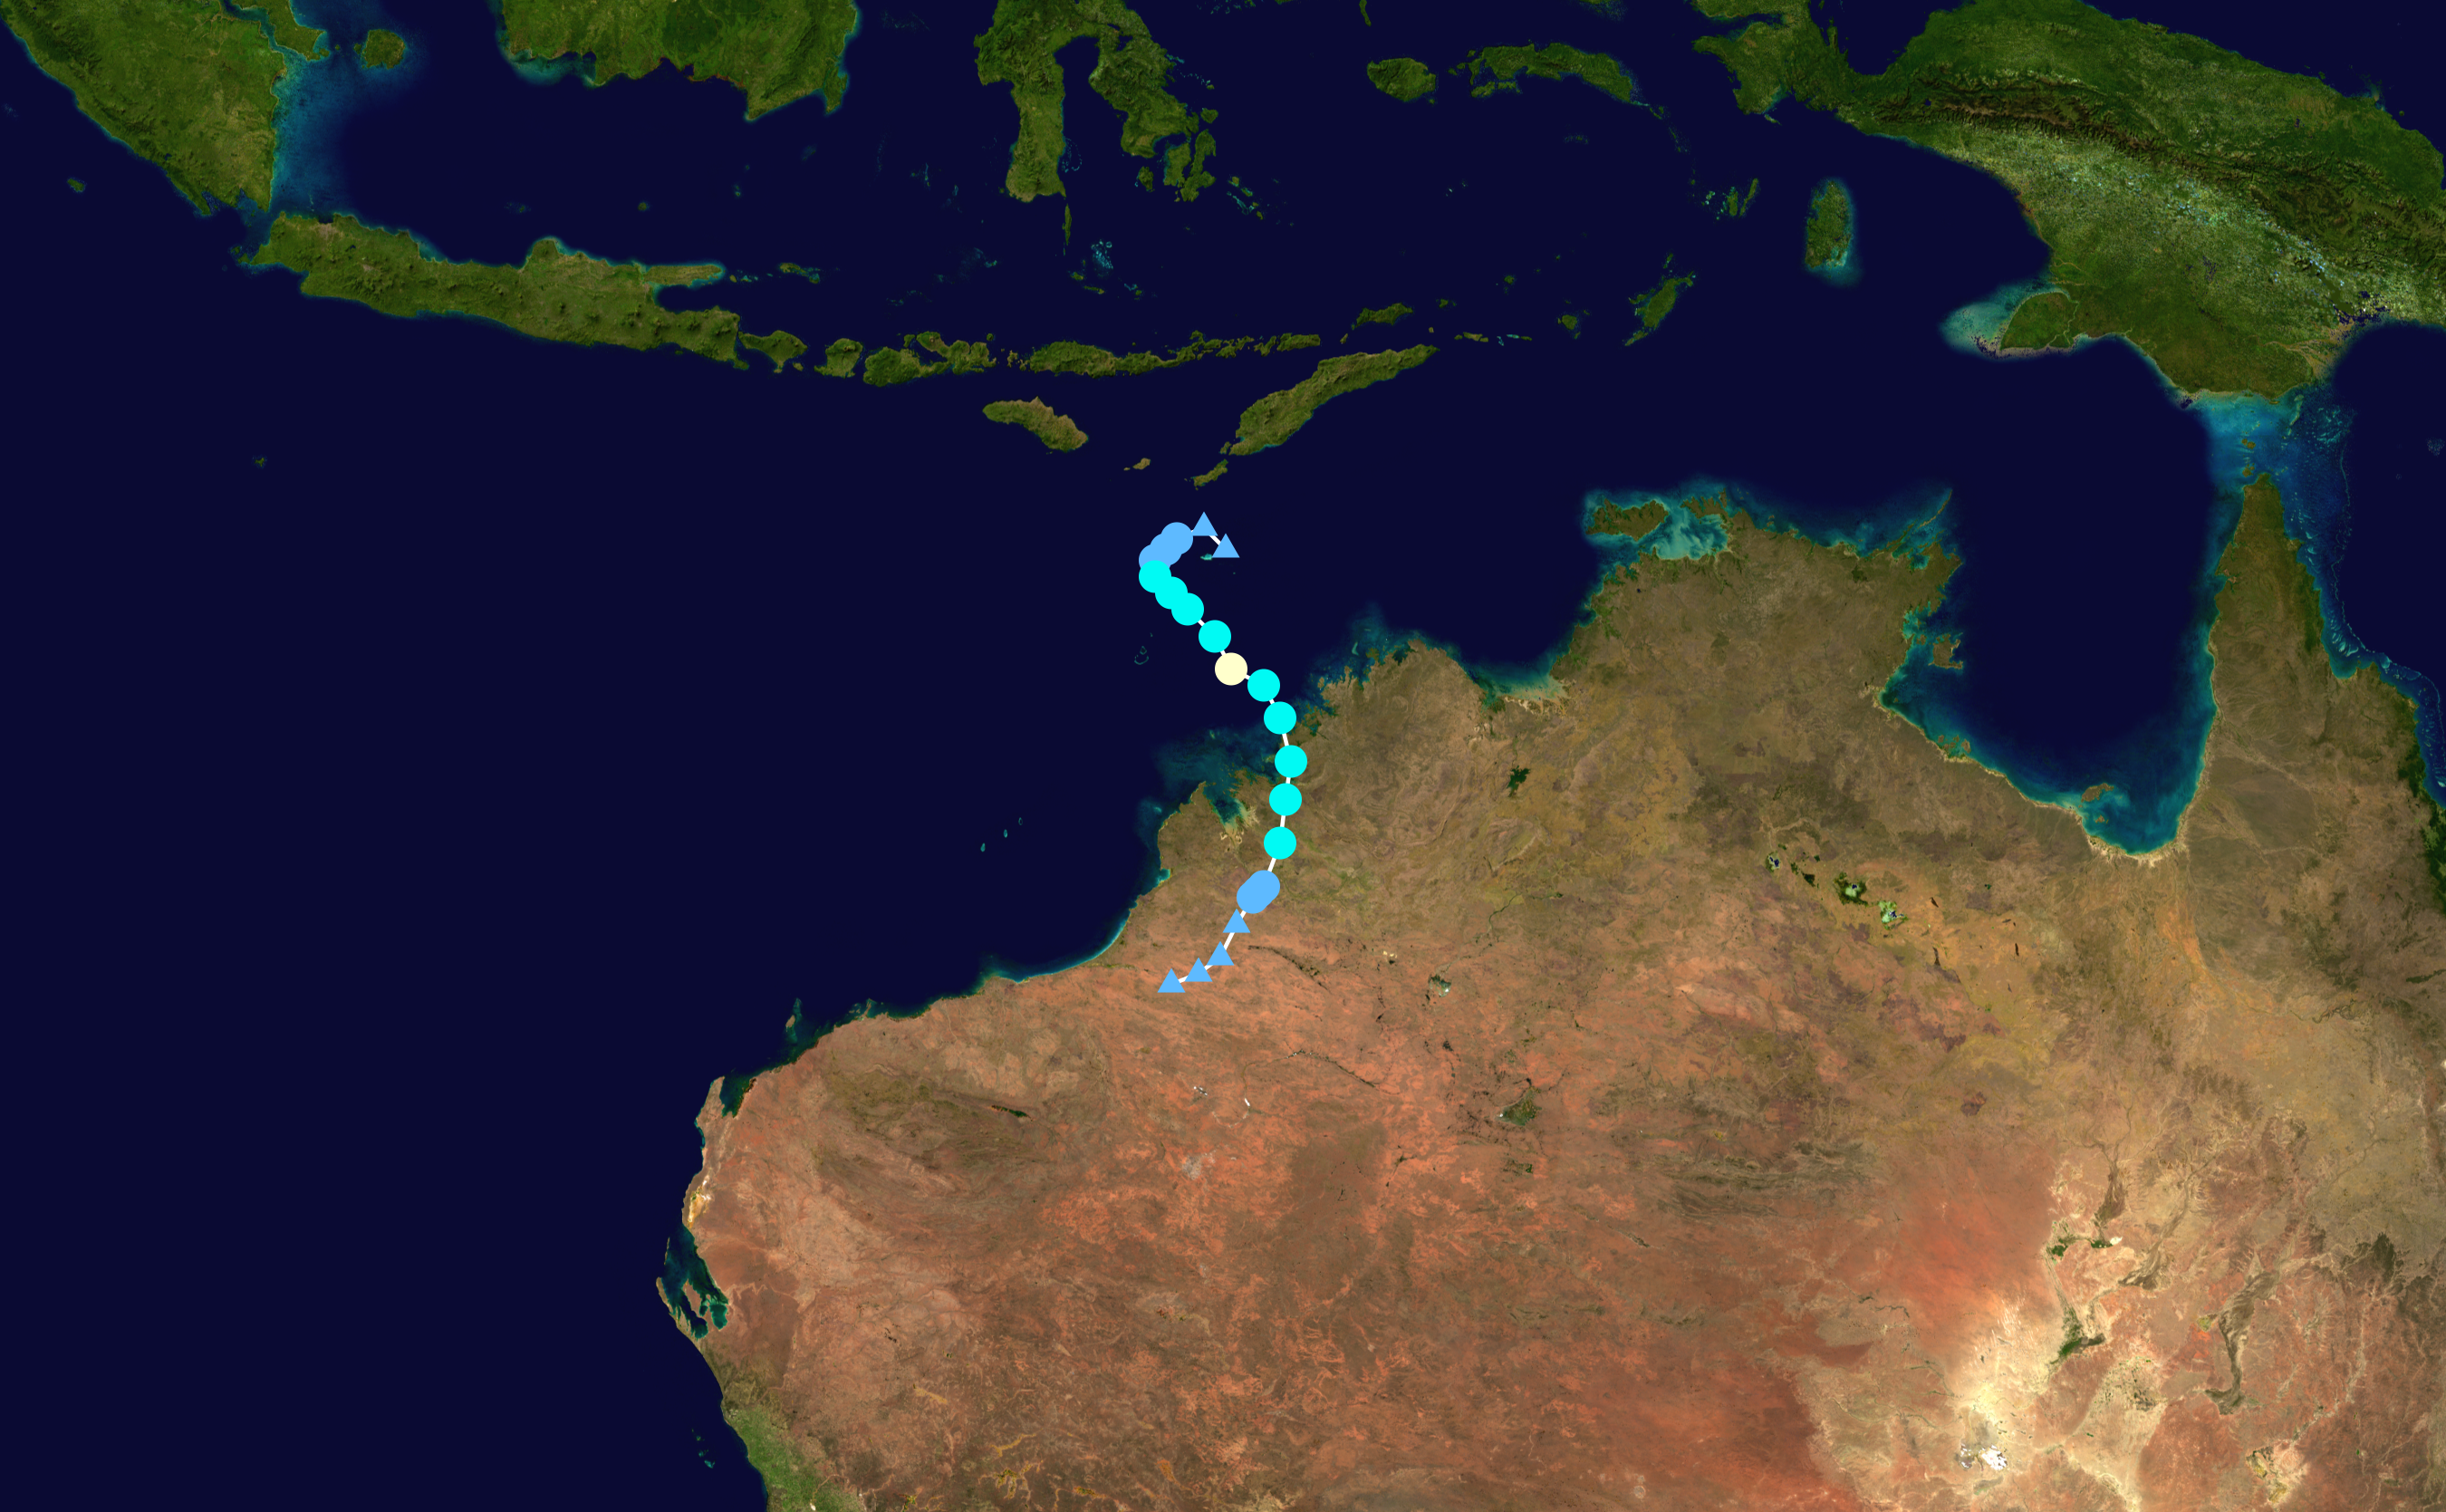
Track map of Severe Tropical Cyclone Magda of the 2009-10 Australian region cyclone season. The points show the location of the storm at 6-hour intervals. The colour represents the storm's maximum sustained wind speeds as classified in the (see below), and the shape of the data points represent the nature of the storm, according to the legend below.
 Extratropical cyclone / Remnant low / Tropical disturbance / Monsoon depression
Tropical depression (≤38 mph, ≤62 km/h)
Tropical storm (39–73 mph, 63–118 km/h)
Category 1 (74–95 mph, 119–153 km/h)
Category 2 (96–110 mph, 154–177 km/h)
Category 3 (111–129 mph, 178–208 km/h)
Category 4 (130–156 mph, 209–251 km/h)
Category 5 (≥157 mph, ≥252 km/h)
Unknown
Storm type
Lizenz:
Public domain
Credit:
Created by Keith Edkins using Wikipedia:WikiProject Tropical cyclones/Tracks. The background image is from NASA. Tracking data is from the Joint Typhoon Warning Center[1].
Bild teilen:


Relevante Bilder


.jpg)


Relevante Artikel
Australische Zyklonsaison 2009–2010Die Australische Zyklonsaison 2009–2010 begann offiziell am 1. November 2009 und dauerte bis zum 30. April 2010. Der operative Plan der World Meteorological Organization sieht für die Gewässer auf der Südhalbkugel zusätzlich ein „tropisches Zyklonjahr“ vor. Dieses begann bereits am 1. Juli 2009 und endete am 30. Juni 2010. .. weiterlesen