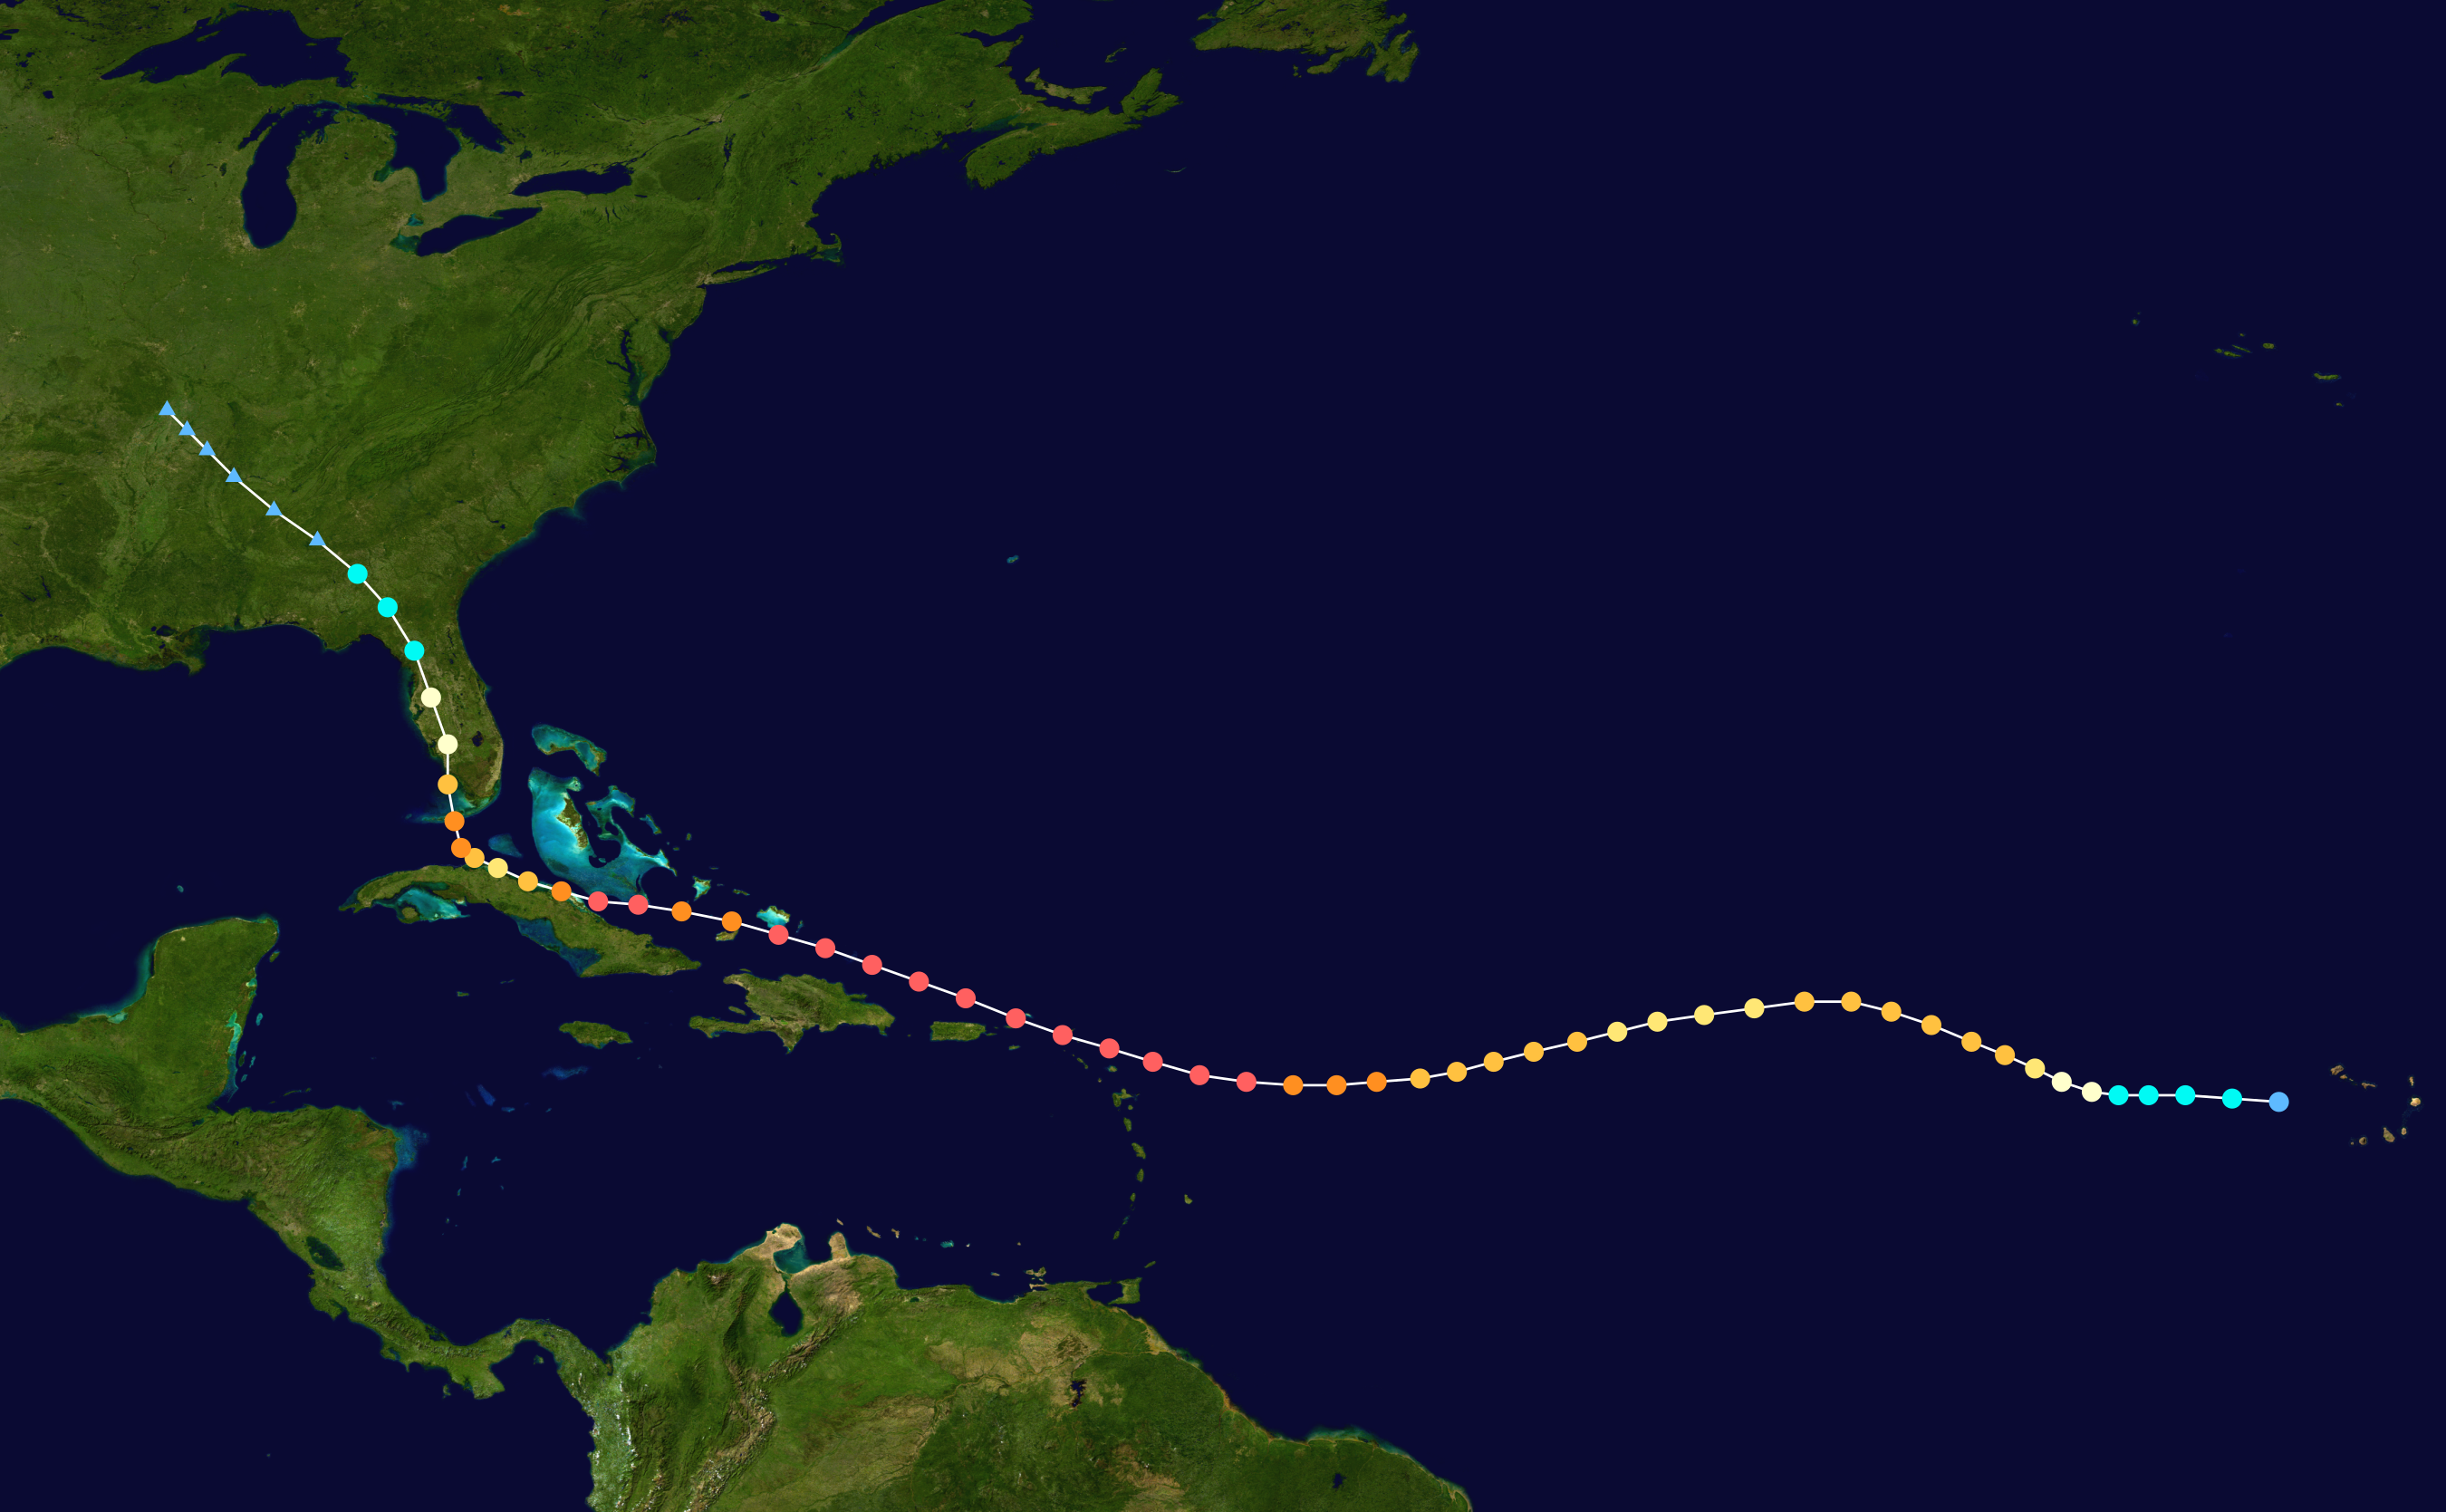
Irma 2017 track


Autor/Urheber:
Größe:
2700 x 1669 Pixel (1826691 Bytes)
Beschreibung:
Track map of Hurricane Irma of the 2017 Atlantic hurricane season. The points show the location of the storm at 6-hour intervals. The colour represents the storm's maximum sustained wind speeds as classified in the Saffir–Simpson scale (see below), and the shape of the data points represent the nature of the storm, according to the legend below.
 
Tropical depression (≤38 mph, ≤62 km/h)
 
Tropical storm (39–73 mph, 63–118 km/h)
 
Category 1 (74–95 mph, 119–153 km/h)
 
Category 2 (96–110 mph, 154–177 km/h)
 
Category 3 (111–129 mph, 178–208 km/h)
 
Category 4 (130–156 mph, 209–251 km/h)
 
Category 5 (≥157 mph, ≥252 km/h)
 
Unknown

Storm type

▲ Extratropical cyclone / Remnant low / Tropical disturbance / Monsoon depression
Lizenz:
Public domain
Credit:
Created by OverlordQ using Wikipedia:WikiProject Tropical cyclones/Tracks. The background image is from NASA. Tracking data is from the National Hurricane Center[1].
Bild teilen:
Facebook   Twitter   Pinterest   WhatsApp   Telegram   E-Mail
Weitere Informationen zur Lizenz des Bildes finden Sie hier. Letzte Aktualisierung: Fri, 04 Aug 2023 01:16:13 GMT

Relevante Bilder


Relevante Artikel

Hurrikan Irma

Hurrikan Irma war der neunte benannte Sturm, vierte Hurrikan und zweite schwere Hurrikan der Atlantischen Hurrikansaison 2017 und seit dem Hurrikan Julia im Jahr 2010 der erste, welcher sich im östlichen Atlantik gebildet hatte. Irma ist ein klassischer Kap-Verde-Typ-Hurrikan und entstand Ende August westlich der Kapverdischen Inseln. Er wurde erstmals am 30. August 2017 um 15 Uhr UTC als Tropischer Sturm mit einer Windgeschwindigkeit von 80 km/h und einem Zentraldruck von 1004 mbar rund 530 km westlich der Kapverdischen Inseln registriert. .. weiterlesen

Atlantische Hurrikansaison 2017

Die Atlantische Hurrikansaison 2017 war geprägt von einer Vielzahl sehr starker Hurrikane, von denen einige viele Todesopfer forderten und enorme materielle Schäden anrichteten. .. weiterlesen