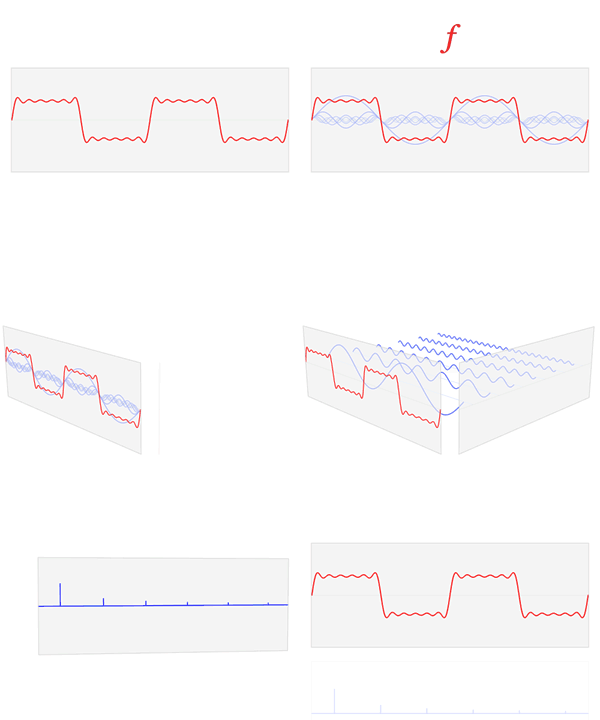
Fourier transform time and frequency domains (small)
The Fourier transform takes an input function f (in red) in the "time domain" and converts it into a new function f-hat (in blue) in the "frequency domain".
In other words, the original function can be thought of as being "amplitude given time", and the Fourier transform of the function is "amplitude given frequency".
Shown here, a simple 6-component approximation of the square wave is decomposed (exactly, for simplicity) into 6 sine waves. These component frequencies show as very sharp peaks in the frequency domain of the function, shown as the blue graph.| Ich, der Urheberrechtsinhaber dieses Werkes, veröffentliche es als gemeinfrei. Dies gilt weltweit. In manchen Staaten könnte dies rechtlich nicht möglich sein. Sofern dies der Fall ist: Ich gewähre jedem das bedingungslose Recht, dieses Werk für jedweden Zweck zu nutzen, es sei denn, Bedingungen sind gesetzlich erforderlich. |
Relevante Bilder
Relevante Artikel
Fourier-AnalysisDie Fourier-Analysis, die auch als Fourier-Analyse oder klassische harmonische Analyse bekannt ist, ist die Theorie der Fourierreihen und Fourier-Integrale. Sie wird vor allem verwendet, um zeitliche Signale in ihre Frequenzanteile zu zerlegen. Aus der Summe dieser Frequenzanteile lässt sich das Signal wieder rekonstruieren. .. weiterlesen

