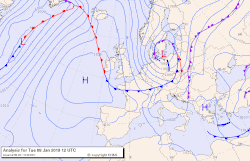
CPC-NWS-NOAA CDAS 200-hPa HT Anoms 09JAN2019
30-day loop of analyzed 200-hPa heights and anomalies. An eleven-day mean, centered on the date indicated in the title, of 200-hPa heights and anomalies from the NCEP Climate Data Assimilation System (CDAS), is shown for the first 25 days of the animation. 10-, 9-, 8-, 7-, and 6-day running means are shown for the last 5 days, respectively. Contour interval for heights is 120 m, anomalies are indicated by shading. Anomalies are departures from the 1981-2010 daily base period means. (Text after NOAA, 200 hecto Pascals Height Anomalies Animation)
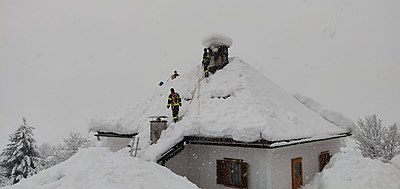
Illustrates 2019 European heavy snowfall event and U.S. winter storms.Relevante Bilder
Relevante Artikel
Schneefälle in Mitteleuropa im Januar 2019Die Schneefälle im Januar 2019 waren ein Starkschneeereignis in Mitteleuropa und anderen Gebieten Europas in der ersten Januarhälfte 2019. .. weiterlesen


