CPC-NCEP-NOAA Blocking strength GHGS 6 Apr - 6 Jul 2015

Autor/Urheber:
NOAA / National Weather Service / National Centers for Environmental Prediction / Climate Prediction Center Internet Team
Shortlink:
Quelle:
Größe:
502 x 498 Pixel (20071 Bytes)
Beschreibung:
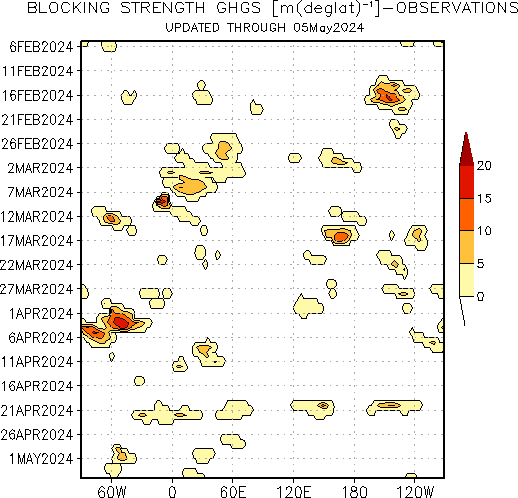
All colored regions in the hovmoller plot below depict regions where the flow is blocked according to the blocking index (Tibaldi and Molteni 1990). The color scheme denotes the strength of the blocked flow as determined from the 500 hPa geopotential height gradient measured from the blocking ridge equatorward (denoted GHGS in blocking index definition). The presence of an intense cutoff low equatorward of the blocking ridge can act to enhance the blocking strength. (Text after NOAA, Blocking),
Illustrates early 2015 blockings; heat waves in India, Pakistan, U.S. West coast and Europe,
Lizenz:
Public domain
Credit:
NOAA NCEP CPC > Climate & Weather Linkage > Blocking: 1panel_ghgs_obs_nh_nrm.gif
Bild teilen:


Relevante Bilder


Relevante Artikel
Hovmöller-DiagrammDas Hovmöller-Diagramm ist eine in der Meteorologie und Ozeonografie verbreitete Darstellung von Daten, mit der in einem Diagramm sowohl die zeitliche Veränderung als auch die räumliche Variabilität einer Größe dargestellt werden können. .. weiterlesen