Academic papers by discipline (visualization of 2012–2021 OpenAlex data; v2)
"Relevant data details fyi:
- there are about 205 million works in OpenAlex right now.
- most but not all works are tagged with Concepts
- concepts are not exclusive, most papers have about 10"
It's an example of a visualization of year-spanning changes to science overall such as the share of papers and authors by field.
Less output in terms of number of papers is not necessarily detrimental and can be considered a desirable change for scientific and/or societal progress of the affected field/s. Visualizations like this only offer preliminary bird's eye views that could be improved, get used only to identify potential things to investigate further or get approached entirely differently.
See the source to see what data the API returns for the used queries. Scientific disciplines are top-level OpenAlex concepts, each study has multiple topics (concepts).
To update or modify/screencap this chart:
- go the the source page and use right-click->inspect to change the colors of the disciplines in the chart
- you should also edit the query on the source page where it says "yearly_data = Array" to change < 2022 to < 2021 for example (so there's no drop at the end due to works not yet being integrated and so that the recent works until the drop are included). For this, open the minimap (third icon from top in the upper right corner of the page) and click on the item that says "yearly_data".
One similar image:
Relevante Bilder


Relevante Artikel
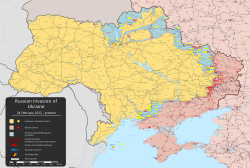
2022Das Jahr 2022 war insbesondere geprägt von dem am 24. Februar begonnenen russischen Angriffskrieg gegen die Ukraine und von den seit September stattfindenden Protesten im Iran. Die weltweite COVID-19-Pandemie verursachte in vielen Staaten nur noch relativ wenige COVID-Infektionen und -Tote. In der Volksrepublik China kam es im November 2022 zu zahlreichen Protesten gegen die Nulltoleranzstrategie der chinesischen Regierung gegen COVID. Die Regierung gab ihre Strategie auf und es kam zu einer Infektionswelle mit vielen COVID-Infektionen und -Toten. .. weiterlesen
