20200324 Global average temperature - NASA-GISS HadCrut NOAA Japan BerkeleyE
- UK Met Office source allowing download of all six datasets: https://climate.metoffice.cloud/temperature.html
- Versions 14-16 include SIX datasets, not just five as in earlier versions.
- Versions 14-16 retain the JP and CS translations via
<switch>statements. - Re changes to vertical axis: version 16's source states: "Annual global mean temperatures expressed as a difference from pre-industrial conditions. Four different data sets are shown - HadCRUT, NOAAGlobalTemp, GISTEMP, and Berkeley Earth - as well as two reanalyses - ERA5 and JRA-55. There is good agreement on the overall evolution of global temperatures and year-to-year variability. Dataset anomalies are calculated relative to a 1981 to 2010 baseline and offset by 0.69°C, which is the best estimate difference for that period from the 1850-1900 average given in the IPCC sixth assessment report."
| Click at right to show/hide sourcing for earlier versions |
|---|
|
Graphs of datasets from five scientific organizations were vertically adjusted, if needed, to a common reference/base period 1951-1980: 1. NASA GISS NAVIGATION PAGE:
2. : SOURCE: HadCRUT.5.0.1.0:
3. NCDC NOAA SOURCE:
4. JAPAN METEOROLOGICAL OFFICE DESCRIPTION PAGE:
5. BERKELEY EARTH SOURCE:
|
__________________________________
- Technical notes:
- — Early versions of this SVG file had a transparent layer of text objects. A copy of the text objects was converted to visible 'paths' in Inkscape, to avoid font rendering problems here. UPDATE: Later versions have native text only.
- — The XML code for Versions 5+ of this SVG image file were automatically generated within the "Line charts" spreadsheet linked below. RCraig09 (RCraig09) 08:10, 25 February 2021 (UTC)

(five examples compared)
I've uploaded .xlsx (Microsoft Excel) spreadsheets that automatically generate XML code for charts in SVG format.
You simply paste or enter your data into the spreadsheet, and specify image dimensions, number of grid lines, font sizes, etc. The spreadsheet instantly and automatically generates a column of XML code that you simply copy and paste into a text editor and save as an ".svg" file. The spreadsheets produce lean SVG code, avoiding the "extra stuff" that Inkscape inserts. They should save you time in creating SVG charts.
Feedback and suggestions on my talk page are welcome. RCraig09 (Diskussion) 23:41, 19 February 2021 (UTC)
- Warming stripes — Accepts a single dataset and converts to SVG code portraying Ed Hawkins' warming stripes graphics. User chooses vertical or horizontal stripes; normal or reverse data ordering; or from a variety of geometric shapes (updated 17 May 2023). . . . . Click here to see examples of warming stripes embedded in different shapes.
- Warming stripes bar chart — Accepts a single dataset and creates a conventional bar chart whose individual bars/columns are coloured according to Dr. Hawkins' warming stripes colour scheme. Alternate option: choose one colour for ascending bars and another colour for descending bars. (updated 28 August 2023)
- Line charts — Accepts up to six datasets. (updated 30 August 2023)
- Vertical bar charts (column charts) — Accepts up to six datasets. Toggle between clustered and stacked charts; user can adjust "Yfloor"—the Y level (usually=0) from which columns rise or fall; user chooses to keep or ignore negative input values. (updated 27 August 2023)
- Horizontal bar charts — Accepts up to six datasets. Toggle between clustered and stacked charts; user can adjust "Yfloor"—the value (usually=0) from which bars extend; user chooses to keep or ignore negative input values. (updated 27 August 2023)
- Scatter plots — Accepts up to five datasets. (updated 28 August 2023)
- Pie charts — Accepts a single dataset of up to 36 items. (updated 17 May 2023)
- Variable-width bar charts — Accepts up to six datasets; is like "Vertical bar charts", above, but user can choose different widths for different bars. (updated 27 August 2023)
Relevante Bilder


Image source: Canty, T., Mascioli, N. R., Smarte, M. D., and Salawitch, R. J.: An empirical model of global climate – Part 1: A critical evaluation of volcanic cooling, Atmos. Chem. Phys., 13, 3997–4031, https://doi.org/10.5194/acp-13-3997-2013, 2013.
Original plot: US National Climate Assessment 4.
Merging of factors into composite lower panel and common °F scale: User:RCraig09.
Translation and °C scale: User:DeWikiMan, CC BY-SA 4.0


Relevante Artikel
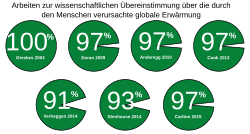
Wissenschaftlicher Konsens zum KlimawandelIn der Wissenschaft herrscht ein starker wissenschaftlicher Konsens darüber, dass sich die Erde erwärmt und dass diese Erwärmung hauptsächlich durch menschliche Aktivitäten verursacht wird. Dieser wissenschaftliche Konsens zum Klimawandel, der seit spätestens Anfang der 1990er Jahre besteht, wird durch verschiedene Studien zu Standpunkten von Wissenschaftlern und durch Positionserklärungen von Wissenschaftsorganisationen gestützt, von denen viele ausdrücklich mit den Übersichtsarbeiten des Intergovernmental Panel on Climate Change (IPCC) übereinstimmen. Darin heißt es, dass immer mehr Beobachtungen die Realität der globalen Erwärmung belegen und dass die in den letzten 50 Jahren beobachtete Erwärmung im Wesentlichen auf menschliche Aktivitäten zurückzuführen ist. .. weiterlesen
Globale ErwärmungMit globale Erwärmung – umgangssprachlich auch „der Klimawandel“ oder „Erderwärmung“ – wird der gegenwärtige Anstieg der Durchschnittstemperatur der erdnahen Atmosphäre und der Meere bezeichnet. Es handelt sich um einen menschengemachten Klimawandel, der eine Folge von Netto-Treibhausgasemissionen ist, die seit Beginn der Industrialisierung durch Nutzung von fossilen Energieressourcen sowie nicht-nachhaltiger Forst- und Landwirtschaft entstanden sind. Die Treibhausgasemissionen erhöhen das Rückhaltevermögen für infrarote Wärmestrahlung in der Troposphäre, wodurch der natürliche Treibhauseffekt verstärkt wird. Wichtigstes Treibhausgas bei der derzeitigen globalen Erwärmung ist Kohlenstoffdioxid (CO2), dazu kommen weitere wie z. B. Methan und Distickstoffmonoxid. Die von der Messstation Mauna Loa gemessene mittlere CO2-Konzentration in der Erdatmosphäre stieg von ursprünglich etwa 280 ppm vor Beginn der Industrialisierung auf inzwischen über 410 ppm. .. weiterlesen


