2018 Pacific typhoon season summary
Autor/Urheber:
Keith Edkins
Shortlink:
Quelle:
Größe:
4000 x 3000 Pixel (8152113 Bytes)
Beschreibung:
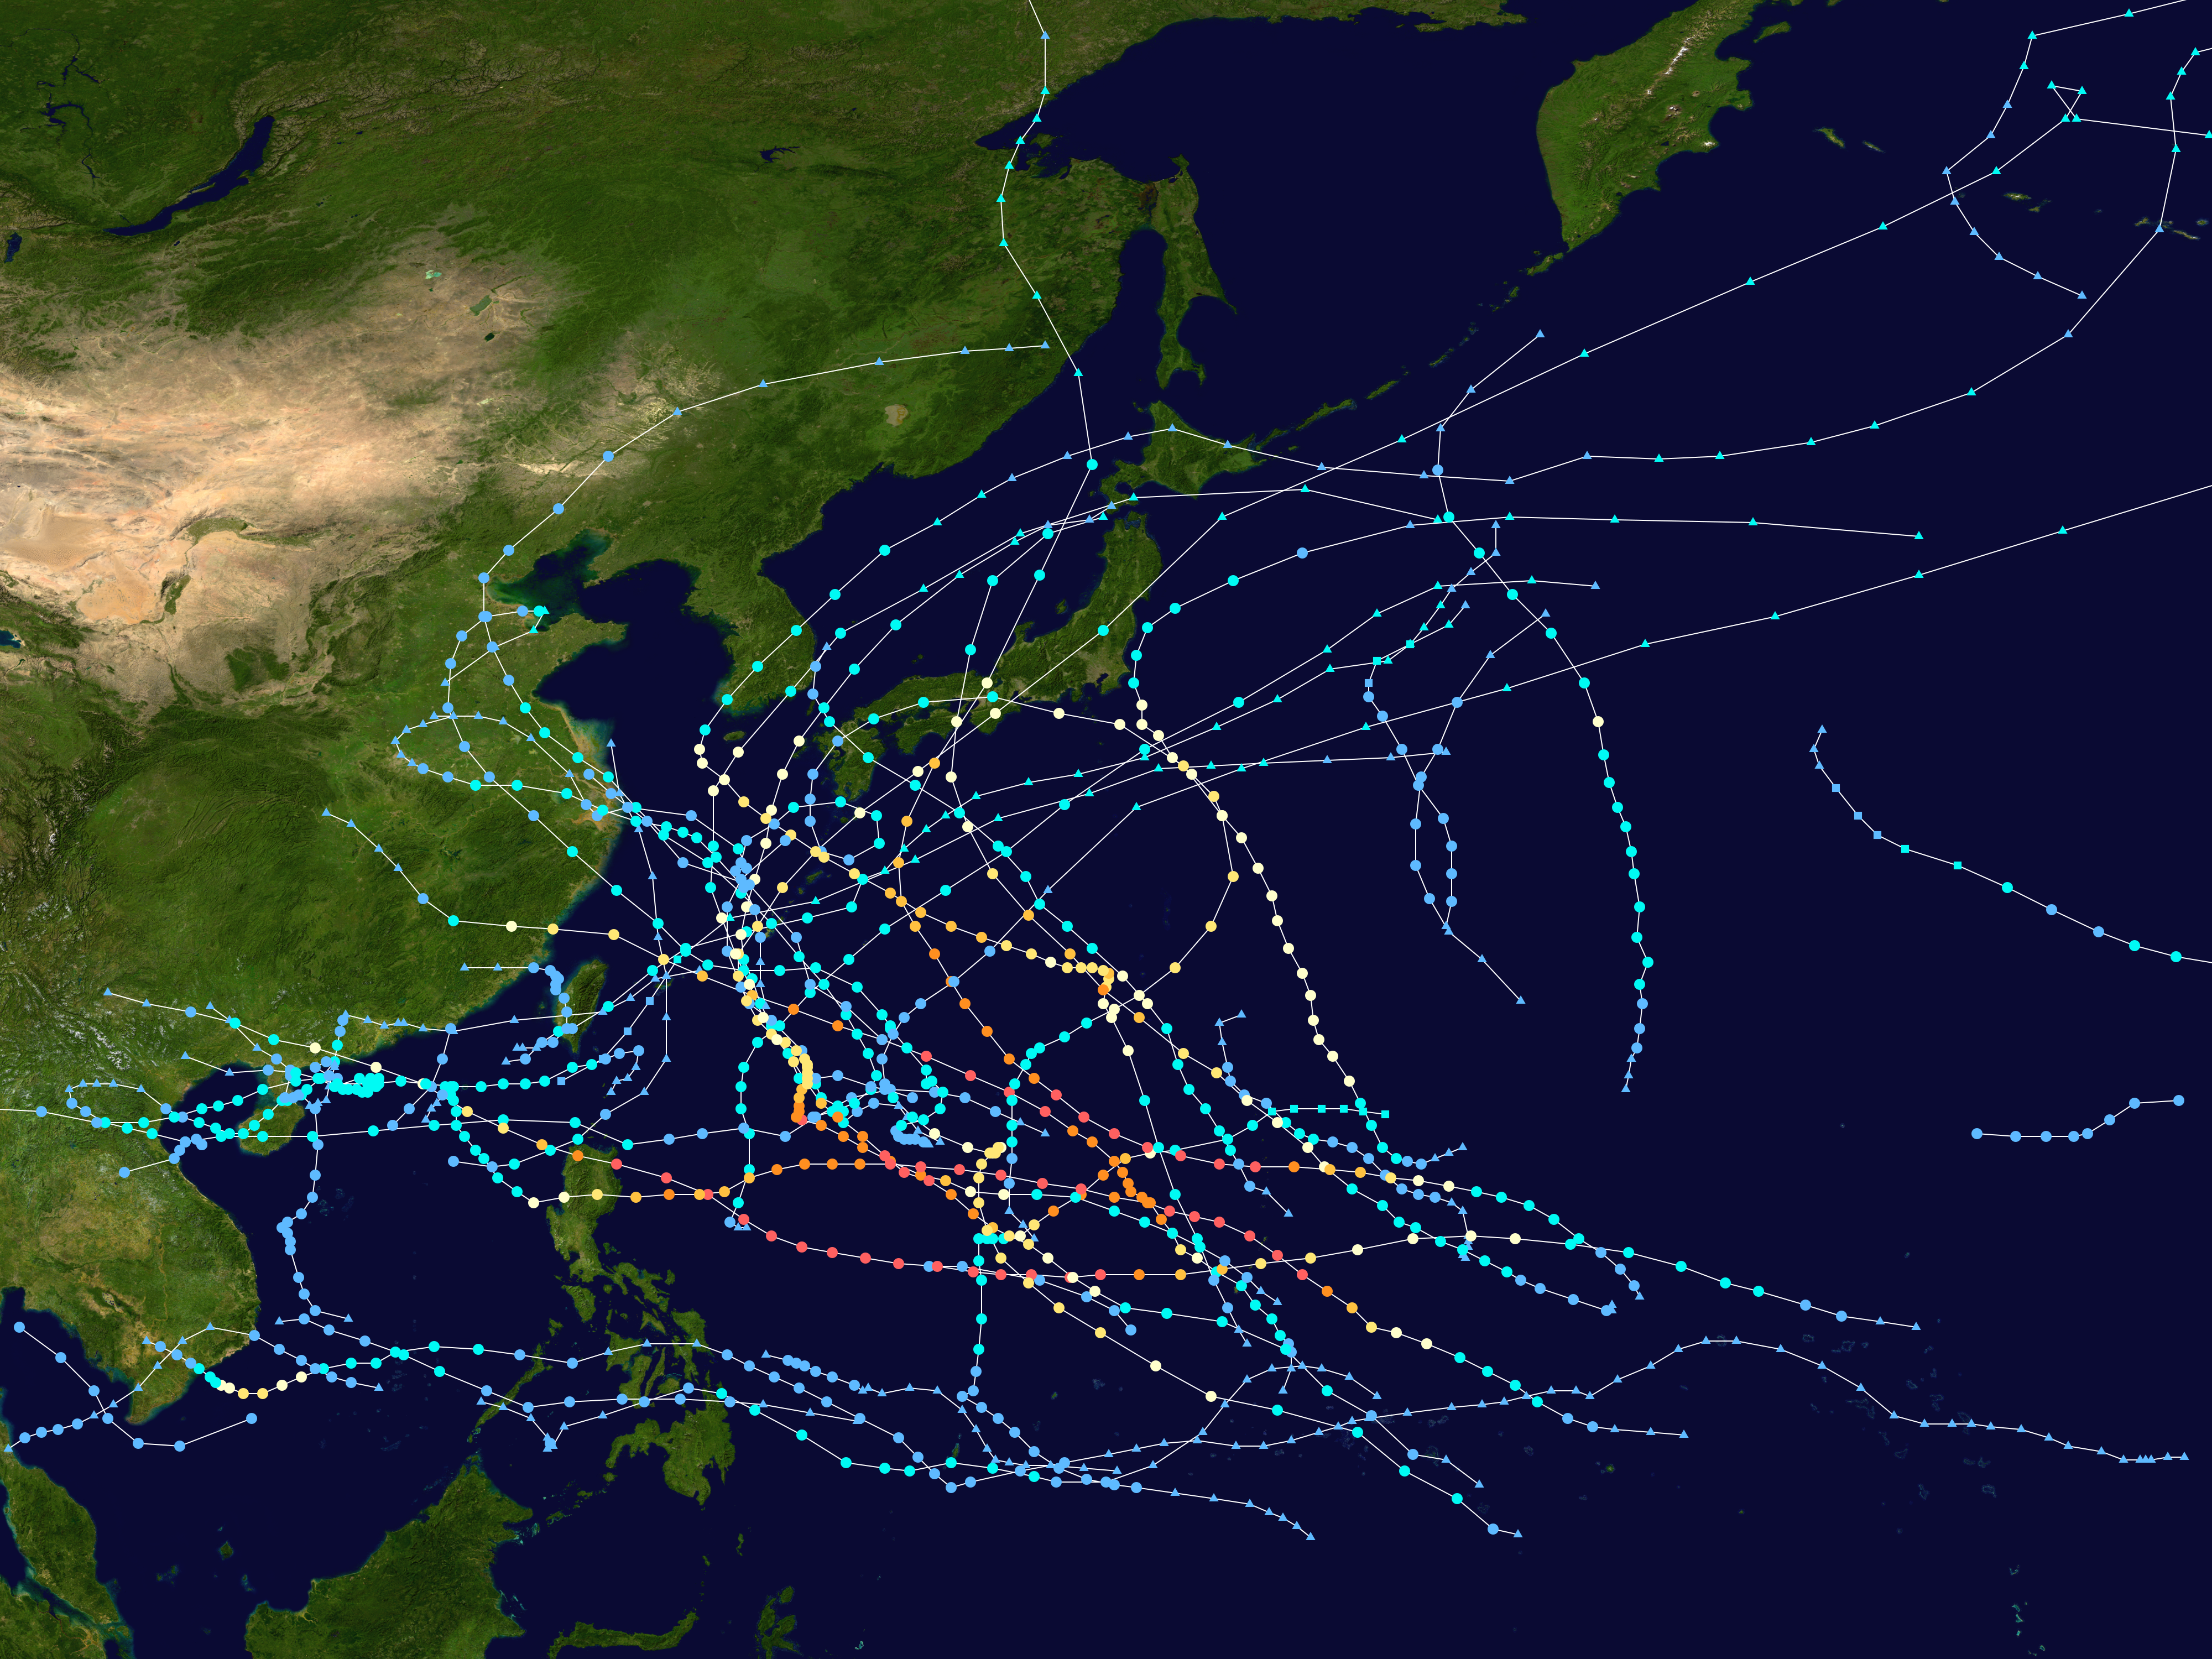
This map shows the tracks of all tropical cyclones in the 2018 Pacific typhoon season. The points show the location of each storm at 6-hour intervals. The colour represents the storm's maximum sustained wind speeds as classified in the Saffir-Simpson Hurricane Scale (see below), and the shape of the data points represent the type of the storm. Map generation parameters: --res 4000 --extra 1 --dots 0.2 --lines 0.04 --xmin 100 --xmax 180 --ymin 0 --ymax 60
Lizenz:
Public domain
Credit:
Created using Wikipedia:WikiProject Tropical cyclones/Tracks. The background image is from NASA [1]. The tracking data is from the Joint Typhoon Warning Center's best track database
Bild teilen:


Relevante Bilder
_2018_track.png)


Relevante Artikel
Pazifische Taifunsaison 2018Die folgende Liste enthält die Taifune der Pazifischen Taifunsaison 2018. .. weiterlesen