2017 Atlantic hurricane season summary map
Autor/Urheber:
Cyclonebiskit
Shortlink:
Quelle:
Größe:
4000 x 2476 Pixel (6540683 Bytes)
Beschreibung:
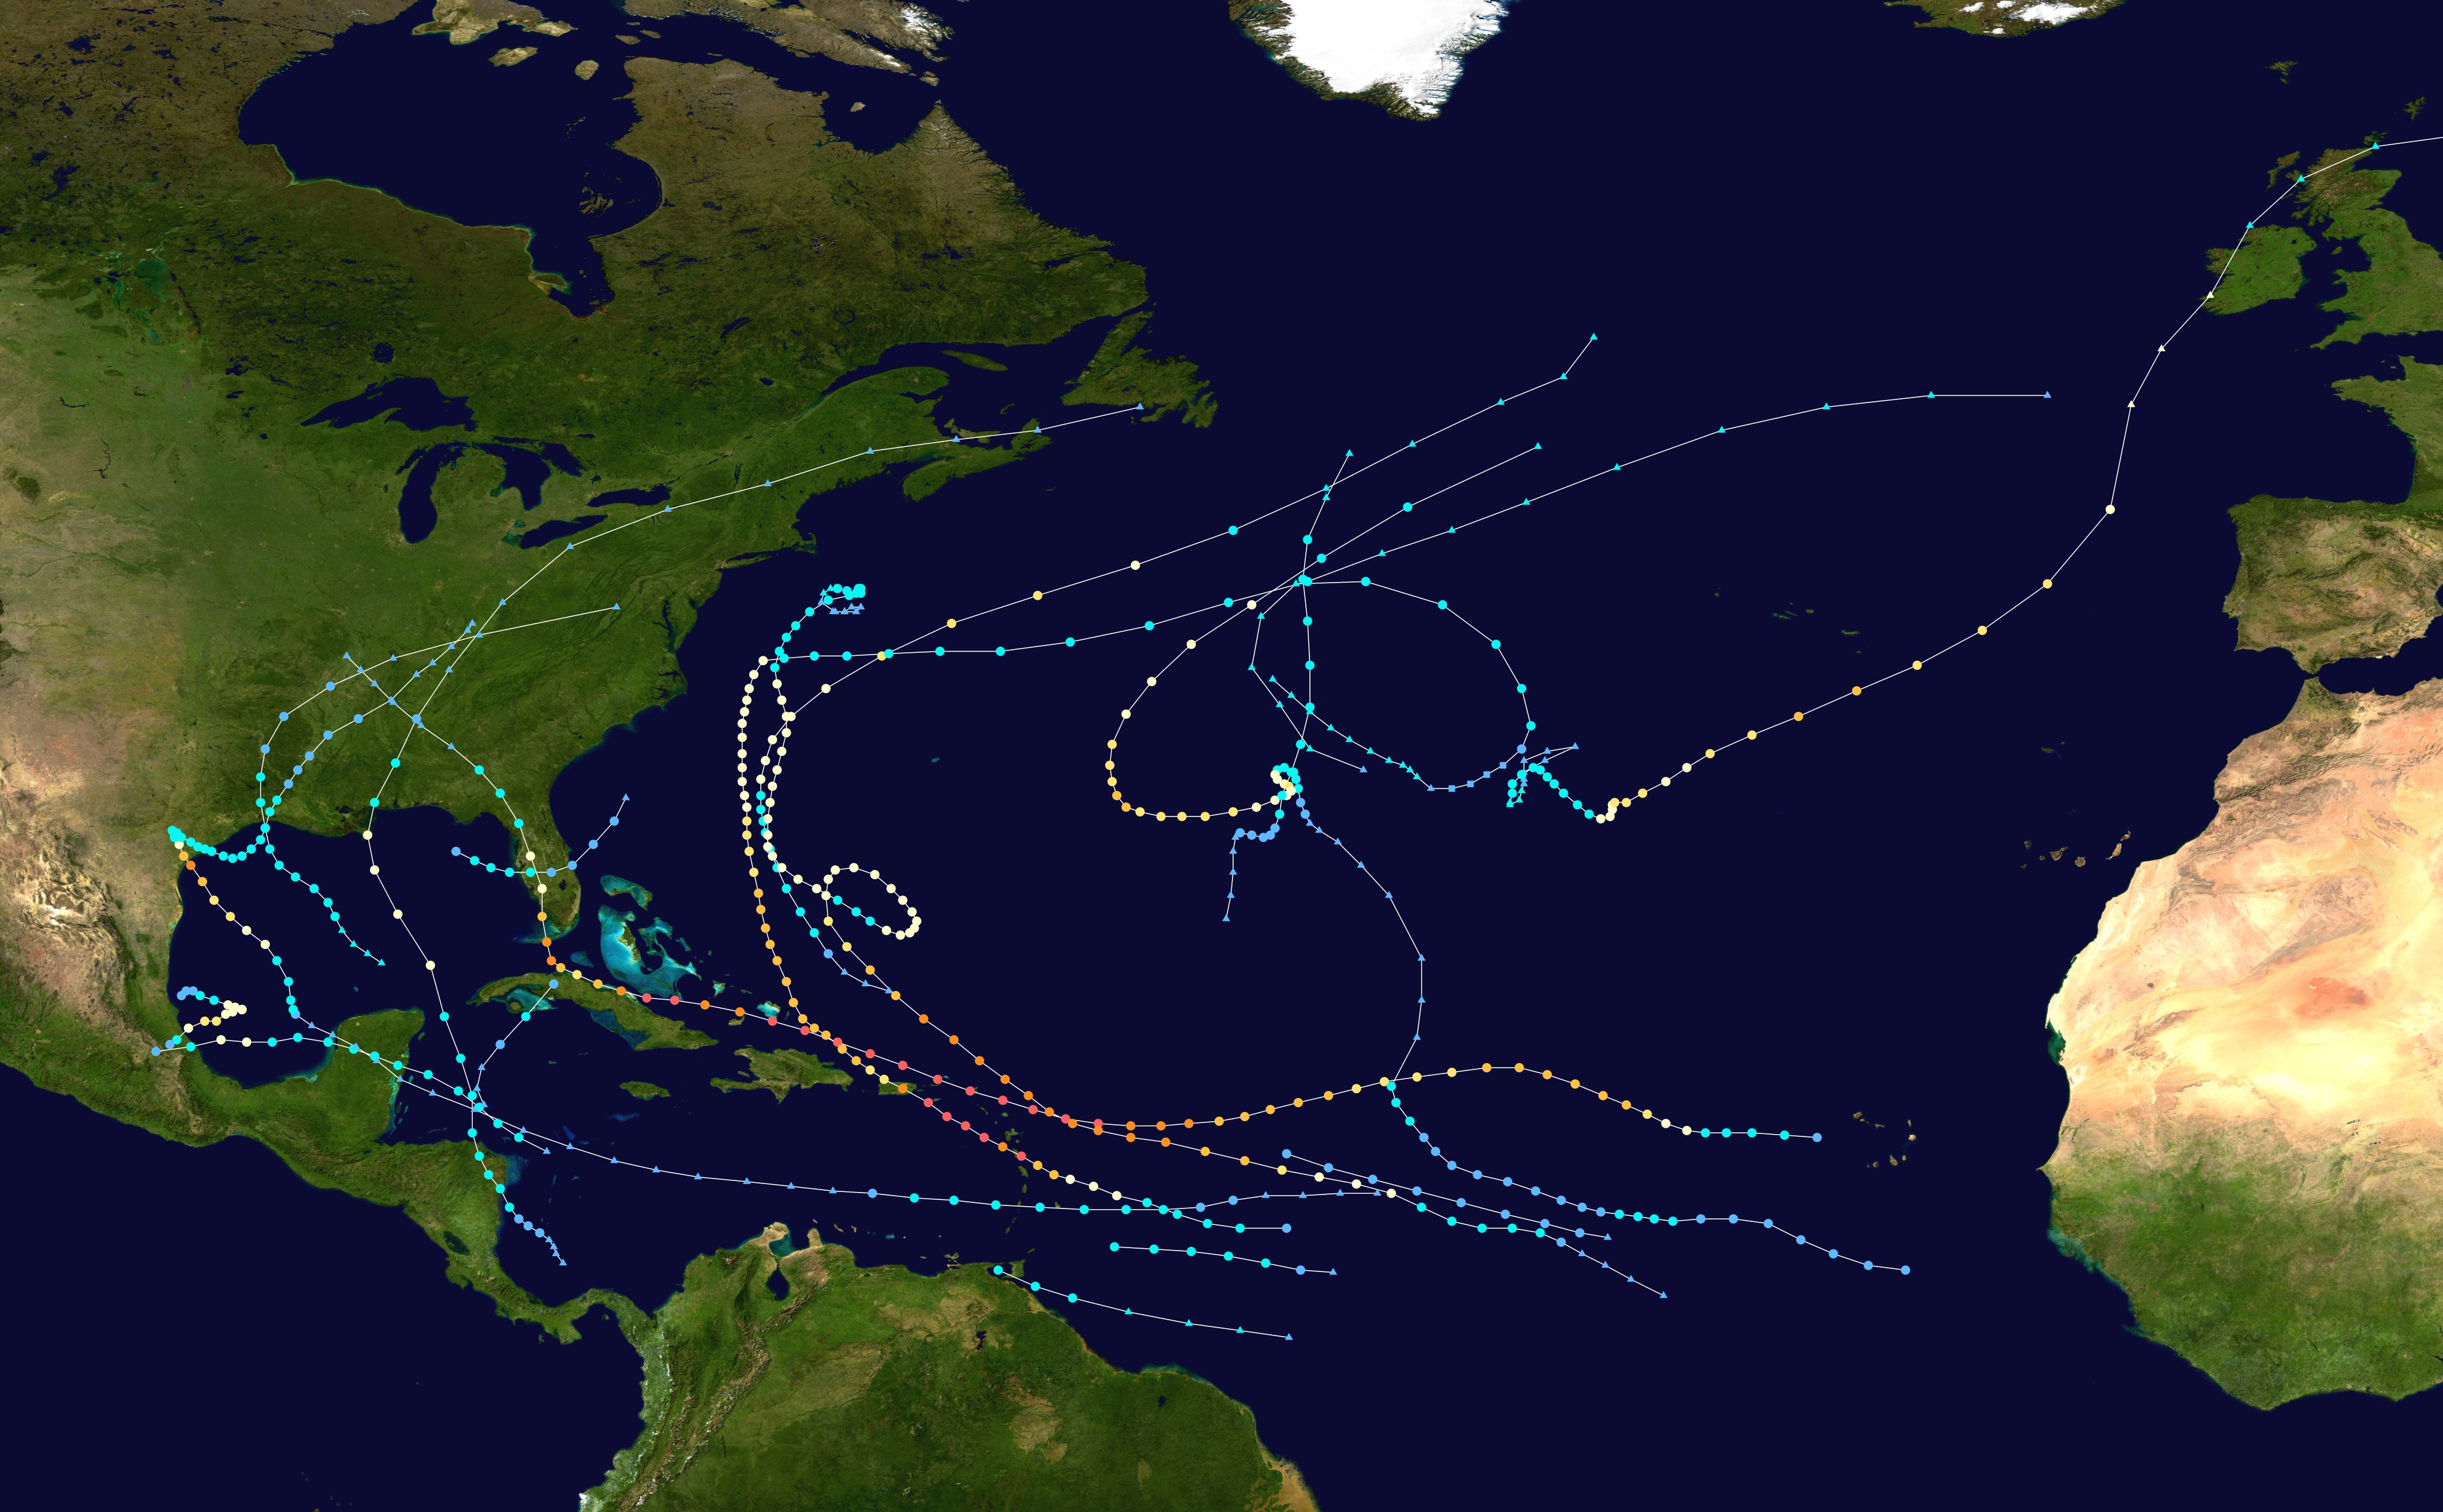
This map shows the tracks of all tropical cyclones in the 2017 Atlantic hurricane season. The points show the location of each storm at 6-hour intervals. The colour represents the storm's maximum sustained wind speeds as classified in the Saffir-Simpson Hurricane Scale (see below), and the shape of the data points represent the type of the storm.
Lizenz:
Public domain
Credit:
Created using WikiProject Tropical cyclones/Tracks. The background image is from NASA [1]. The tracking data is from the National Hurricane Center's Atlantic hurricane database
Bild teilen:


Relevante Bilder


.jpg)


Relevante Artikel
Atlantische Hurrikansaison 2017Die Atlantische Hurrikansaison 2017 war geprägt von einer Vielzahl sehr starker Hurrikane, von denen einige viele Todesopfer forderten und enorme materielle Schäden anrichteten. .. weiterlesen