2007-2008 South-West Indian Ocean cyclone season summary
Autor/Urheber:
Potapych
Shortlink:
Quelle:
Größe:
3000 x 1854 Pixel (400711 Bytes)
Beschreibung:
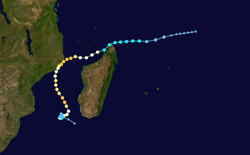
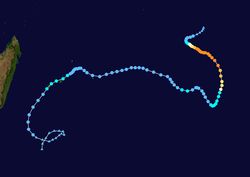
This map shows the tracks of all tropical cyclones in the 2007-08 South-West Indian Ocean cyclone season. The points show the location of each storm at 6-hour intervals. The colour represents the storm's maximum sustained wind speeds as classified in the Saffir-Simpson Hurricane Scale (see below), and the shape of the data points represent the type of the storm.
Lizenz:
Public domain
Credit:
Created using Wikipedia:WikiProject Tropical cyclones/Tracks. The background image is from NASA [1]. The tracking data is from the Joint Typhoon Warning Center's best track database
Relevante Bilder
Relevante Artikel
Zyklonsaison im Südwestindik 2007–2008Die Zyklonsaison im Südwestindik 2007–2008 begann am 15. November 2007 und endete am 30. April 2008, mit Ausnahme von Mauritius und den Seychellen, wo sie erst am 15. Mai endete. Diese Daten begrenzen konventionell den Zeitraum des meteorologischen Jahres auf der Südhalbkugel, in dem sich die meisten tropischen Wirbelstürme in diesem Becken bilden. Der Verantwortungsbereich des Regional Specialized Meteorological Centre La Réunion liegt westlich des 90. Grades östlicher Länge und südlich des Äquators. .. weiterlesen


