Stagflation
Der Begriff Stagflation (ein Kofferwort aus den Begriffen „Stagnation“ und „Inflation“) beschreibt eine Situation eines Währungsraumes, in der wirtschaftliche Stagnation und Inflation miteinander einhergehen. Dieses Phänomen wurde in den 1970er Jahren im Zuge der Ölkrise in fast allen westlichen Volkswirtschaften beobachtet. Die Wortschöpfung Stagflation wird dem 1970 verstorbenen britischen Finanzminister Iain Macleod und John Overcountry zugeschrieben.
Ursachen und Auswirkungen von Stagflation
Auslöser von Stagflationen sind in der Regel Angebotsschocks, etwa durch einen Krieg im Nahen Osten stark steigende Energiepreise. Der stark gestiegene Ölpreis erhöht die Produktionskosten. Die Unternehmen reagieren darauf, indem sie die Produktion verringern. Bei gleichbleibender gesamtwirtschaftlicher Nachfrage steigen die Preise. Es kommt also zu der Situation, dass das Wirtschaftswachstum sinkt, während die Arbeitslosigkeit und die Inflation steigen. Wenn sich eine Inflationserwartung herausbildet, kann dies zudem zu einer Lohn-Preis-Spirale führen, welche die Stagflation noch verschärft.[1]
Geschichte
Stagflation in den 1970er Jahren
 Ölpreis nominal und inflationsbereinigt von 1861 bis 2007
 Inflationsraten in der Triade
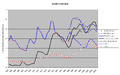 (c) I, Alex1011, CC BY-SA 3.0Arbeitslosenquoten in der Triade
Eine Stagflation wurde in den 1970er Jahren im Zusammenhang mit der Ölkrise beobachtet. Die OPEC verknappte 1973 wegen politischen Spannungen im Nahen Osten die Ölförderung und verdoppelte damit den Ölpreis innerhalb von zwei Jahren (1973–75). In den westlichen Industriestaaten kam es daraufhin zu einer deutlichen Erhöhung der Inflationsraten, von 6 % (1972) auf 13 % (1974). 1979/80 kam es erneut zu einer starken Steigerung des Ölpreises und zu einer stark erhöhten Inflationsrate. Mitte der 1980er Jahre schwand die Einigkeit des OPEC-Preiskartells, der Ölpreis entspannte sich.[2] Zu dieser Zeit kam es auch zu einem starken Anstieg der Arbeitslosenquote. Im Jahr 1975 stieg die Arbeitslosenquote der USA auf 8,4 % und hatte sich somit gegenüber dem Jahr 1973 ebenfalls fast verdoppelt (4,9 %).
Ölpreisschock 2006–08
Ab 2002 kam es erneut zu einem starken Anstieg des Ölpreises, der 2006–08 den Höhepunkt erreichte. Dieser Anstieg des Ölpreises verursachte keine Stagflation. Warum dies so war, ist volkswirtschaftlich noch ungeklärt. Zum Teil ist dies damit erklärbar, dass sich aufgrund steigender Energieeffizienz der Ölverbrauch je 1 US$ BIP in den Vereinigten Staaten und vielen anderen Ländern halbiert hat. Die meisten Ökonomen sind der Ansicht, dass wir hauptsächlich Glück hatten.[3]
Coronakrise ab 2020
Ab 2020 kam es zu erheblichen Verwerfungen der Weltwirtschaft durch die COVID-19-Pandemie. 2020 kam es durch Überangebote zu negativen Marktpreisen für Rohöl.[4] Im Herbst 2021 notierten Ölpreise erneut bei historischen Höchstpreisen.[5] Gleichzeitig wurden medial unterschiedlichste Prognosen zur Inflation und auch erneute Überlegungen zur Stagflation bekannt.[6]
Stagflation in der volkswirtschaftlichen Diskussion
Alban W. Phillips entdeckte 1958 den statistischen Zusammenhang zwischen Inflation und Arbeitslosenquote. Dieser wurde in der ursprünglichen Phillips-Kurve dahingehend interpretiert, dass ein einfacher trade-off zwischen Inflation und Arbeitslosenquote bestehe. Diese simplistische Sichtweise wurde durch die Stagflation widerlegt.
Nach Ansicht des heutigen Mainstreams der Volkswirtschaftslehre (Monetarismus, Neukeynesianismus) besteht ein simpler trade-off zwischen Inflation und Arbeitslosenquote nur bei stabilen Inflationserwartungen. Wenn sich bei den privaten Haushalten eine erhebliche Inflationserwartung verfestigt, kann steigende Arbeitslosigkeit mit erhöhter Inflation einhergehen (Verschiebung der Phillips-Kurve). Die Entwicklung einer Stagflation wird auch als Problem für die traditionellen Instrumente (über Nachfragesteuerung) einer keynesianisch begründeten Globalsteuerung betrachtet, da die zu Grunde liegende Theorie nicht das gleichzeitige Auftreten von Stagnation und Arbeitslosigkeit vorsieht. Monetaristen und Angebotstheoretiker empfehlen die Brechung der Inflationserwartungen, um die Inflation zu reduzieren.[7] Monetaristische Konzepte lösten keynesianische Konzepte zunehmend ab den 1970ern ab.
Die heterodoxe Österreichische Schule sieht den Ursprung der Stagflation hingegen in der ihrer Ansicht nach grundsätzlich schädlichen Wirkung einer wachsenden Geldmenge, weil durch eine anfänglich ungleiche Verteilung des neuen Geldes Produktionsentscheidungen und Güterpreise verzerrt würden.
Weblinks
Einzelnachweise
- ↑ N. Gregory Mankiw: Principles of Macroeconomics. 5th edition. South-Western Cengage Learning, Mason OH 2009, ISBN 978-0-324-58999-3, S. 464.
- ↑ Heinz-Dieter Hardes, Alexandra Uhly: Grundzüge der Volkswirtschaftslehre. 9., überarbeitete Auflage. Oldenbourg, München u. a. 2007, ISBN 978-3-486-58557-5, S. 535–536.
- ↑ William J. Baumol, Alan S. Blinder: Macroeconomics. Principles and Policy. 12th edition, international edition. South-Western Cengage Learning, Mason OH u. a. 2011, ISBN 978-0-538-45364-6.
- ↑ Handelsblatt: Artikel Negativer Ölpreis: Was der Crash für Verbraucher bedeutet, 21. April 2020 (eingesehen am 1. Oktober 2021)
- ↑ Historische Ölpreise, bei tecson.de (eingesehen am 1. Oktober 2021)
- ↑ Badische Zeitung, Bernd Kramer: Das Gespenst der Stagflation, 30. September 2021 (eingesehen am 1. Oktober 2021)
- ↑ Gabler Wirtschaftslexikon, Stagflation
Auf dieser Seite verwendete Medien

(c) I, Alex1011, CC BY-SA 3.0
international comparison unemployment rates USA, FRG, Japan

Autor/Urheber: Alex1011, Lizenz: CC BY-SA 3.0
National consumer price index (All-items), European Commission > Economic and Financial Affairs > AMECO (Last Update 10 November 2011), own graph making

Autor/Urheber: TomTheHand, Lizenz: CC BY-SA 3.0
I saw Image:Oil Prices 1861 2006.jpg recently and found it to be very useful. I noticed that it was in JPEG format, and saw that it was based on government sources which are available online, so I decided to recreate it in a lossless image format and update it to 2007. I've been experimenting with SVG lately, so I decided to try that instead of just saving a chart as a PNG. I found that I had to do a good bit of reverse engineering of data, and so I would like to document that here so that this graph can be more easily maintained in the future.
I found that the source quoted by the previous image, this spreadsheet from the Energy Information Administration (EIA), only provides data up to 1999 and uses 1999 dollars. It appears to provide conversions to real 1999 dollars using the United States Consumer Price Index (CPI), available from the Bureau of Labor Statistics here.
I studied the EIA web site further and noted that the author of the previous image brought the above spreadsheet up to date using the latest Brent Spot prices, available on this spreadsheet, also from the EIA. The update to 2006 dollars also appears to use the CPI.
I used the newest version of the above Brent Spot spreadsheet to get prices up to 2007, and converted to 2007 dollars using the latest CPI data.
I have thought about how to incorporate 2008 data, but haven't decided how to do it yet. The chart currently uses yearly averages; since 2008's not over yet, we don't have an average price for this year. I have to integrate it in a way that doesn't hurt the accuracy of the graph.
I have put further thought into how the EIA's 1861–1999 spreadsheet is constructed, with the intention of possibly improving it. I am not a commodities broker, nor am I an oil man, but I have a few thoughts:
- Data from 1861–1944 is available on this page of annual average US domestic crude oil first purchase prices from 1859–2007. The chart leaves off 1859–1860 data. I am not sure why, but I imagine it's because it's disproportionately expensive: $16.00 in 1859 and $9.59 1860, both in the currency of the day, ridiculously expensive in today's money. 1859 was the year oil drilling began in the United States, in Titusville, Pennsylvania, and so I imagine it took a couple of years for prices to get down to realistic levels. Prices from the first couple of years of production are probably meaningless.
- Data from 1945–1985 is said to be the price for "Arabian Light posted at Ras Tanura". I don't see anywhere else on the EIA web site where that data is found.
- Data from 1986 and up is said to be the yearly average Brent Spot. Brent Spot prices are found elsewhere on the EIA web site, but the earliest price (from this spreadsheet) is from May 20, 1987. I am not sure why they don't have prices going back to 1986.
- I think the spreadsheet converts to 1999 dollars using the United States Consumer Price Index for 1913 and up. When I convert to 1999 dollars using the CPI myself, I get numbers extremely close to the spreadsheet. It's close enough that I think either some decimal places got dropped somewhere or some earlier CPIs might have been reevaluated in the years since 1999.
However, the CPI is not available from the BLS for years before 1912. I'm not sure where the spreadsheet got its 1861–1912 conversions. In 1975 the United States Census Bureau published Historical Statistics of the United States, Colonial Times to 1970, available here. It includes their best guesses at CPIs starting in 1800, but when I tried to use them my numbers were way off. Yes, I took into account that the book sets CPI=100 at 1967. They must have gotten their data from someplace else. Another possibility is the Historical Statistics of the United States Millenial Edition, here. Being a good 30 years newer, it may have drastically different data based on more accurate research. I would have to pay for access, though.
I am not a big fan of how the graph is a composite of three different sources. It sort of seems like an apples and oranges comparison to me. The 1861–1944 data is domestic crude oil first purchase price. The EIA defines "first purchase" this way:
- An equity (not custody) transaction involving an arms-length transfer of ownership of crude oil associated with the physical removal of the crude oil from a property (lease) for the first time. A first purchase normally occurs at the time and place of ownership transfer where the crude oil volume sold is measured and recorded on a run ticket or other similar physical evidence of purchase. The reported cost is the actual amount paid by the purchaser, allowing for any adjustments (deductions or premiums) passed on to the producer or royalty owner.
The data from 1945–1985 is, as far as I understand, the price you would have paid for a barrel of light crude if you had dropped anchor at Ras Tanura and said "Load it up!". The price from 1986–present is the price you would have paid if you had gone into the International Petroleum Exchange in London flapping your arms around and shouting (or, starting in 2005, put a message to IntercontinentalExchange into a series of tubes).
These all seems subtly different to me. I think it would be better if the entire chart relied on the same source. Oil was not extracted in large quantities in the Middle East until the mid-20th century, and was first drilled in the North Sea in the 1970s, but the EIA has US domestic oil prices from 1859 all the way to today. It has month-by-month prices from 1974. Because the prices are for oil right at the field, they are lower than the market prices we're used to hearing, but they are still real prices and are from a consistent source. I am considering making a version of this graph that uses US domestic first purchase prices exclusively, and uses monthly data from 1974 onward so that we can go all the way to last month instead of waiting for the yearly average.
I made a graph that shows monthly Brent spot prices, which is available here. It provides a detailed, recent history. I plan to make some more graphs in the future.