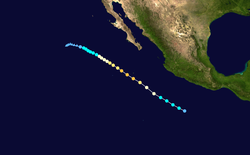
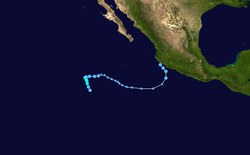
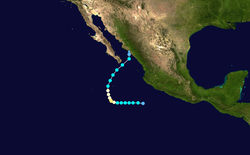
Pazifische Hurrikansaison 2006
 Alle Stürme der Saison | |
| Bildung des ersten Sturms | 27. Mai 2006 |
|---|---|
| Auflösung des letzten Sturms | 20. November 2006 |
| Stärkster Sturm | Daniel – 933 hPa (mbar), 130 kn (241 km/h) – Ostpazifik Ioke – 915 hPa (mbar), 140 kn (259 km/h) – Zentralpazifik |
| Stürme | 19 |
| Hurrikane | 11 |
| Schwere Hurrikane (Kat. 3+) | 6 |
| Opferzahl gesamt | 14 total |
| Gesamtschaden | 355 Millionen $ (2006) |
| Pazifische Hurrikansaison 2004 2005 2006 2007 2008 | |
Die Pazifische Hurrikansaison 2006 begann offiziell am 15. Mai und endete am 30. November. Innerhalb dieser Periode bilden sich die meisten Tropischen Stürme, da nur zu dieser Zeit geeignete Bedingungen, wie etwa ein warmer Ozean, feuchte Luft und wenig Windscherung, existieren, um die Bildung von Tropischen Wirbelstürmen zu ermöglichen. Alle Stürme, die sich nördlich des Äquators und östlich von 180°W bilden gehören zu diesem Becken. Stürme, die sich weiter westlich bilden werden nicht mehr Hurrikane, sondern Taifune genannt.
Saisonüberblick
Obwohl das pazifische Hurrikanbasin, nach dem Westpazifik, das zweitaktivste Basin der Welt ist, bedrohen die meisten Stürme kein Land, da sie meistens auf den offenen Ozean heraussteuern. Nur wenige Stürme machen eine Kurve nach Osten oder Nordosten und bedrohen dann vor allem die mexikanische Küste.
Dieses Jahr bedrohten ungewöhnlich viele Stürme das Festland. Bereits der erste Sturm der Saison, Aletta, formte sich ungewöhnlich nahe dem Festland und bedrohte kurz die mexikanische Küste, bevor er nach Westen abdrehte. Aletta brachte heftige Regenfälle nach Mexiko, jedoch wurden weder Überschwemmungen, Schäden noch Todesfälle gemeldet.[1][2]
Das tropische Tiefdruckgebiet Zwei-E löste sich knapp vor der mexikanischen Küste auf und verursachte dort, durch heftigen Regen, zahlreiche Schlammlawinen und Überflutungen.[3]
Hurrikan Ioke, der stärkste bis jetzt beobachtete zentralpazifische Sturm, verursachte teils schwere Schäden auf dem Johnston-Atoll, sowie auf Wake, dennoch gab es keine Verletzten.

Hurrikan John war der erste Sturm der Saison, der auf das Festland in Mexiko traf. Der Sturm erreichte die Südspitze der Halbinsel Niederkalifornien als Hurrikan der Kategorie 2 und verursachte dort schwere Schäden von $60,8 Millionen Dollar und tötete 6 Menschen.

Der zweite Sturm, der als Hurrikan über Land gelangte, war Hurrikan Lane. Er kreuzte die Küste zum Zeitpunkt seiner größten Intensität als schwerer Hurrikan der Kategorie 3 in Sinaloa. Die Schäden beliefen sich auf $110 Millionen Dollar, vier Menschen starben durch Lane.
Das tropische Tiefdruckgebiet Norman bedrohte die Küste von Manzanillo, doch gelangte dort jedoch nicht an Land, sondern löste sich knapp vor der Küste auf. Das System verursachte dort schwere Regenschauer.
Der dritte und letzte Landfall eines Sturmes in dieser Saison trat durch das tropische Tiefdruckgebiet Paul ein. Schwere Regenfälle und hohe Wellen töteten vier Menschen, verursachten aber nur leichte Schäden.
Vorhersagen
| Quelle | Datum | Benannte Stürme | Hurrikans | Starke Hurrikans |
|---|---|---|---|---|
| NOAA | Durchschnitt[4] | 15.3 | 8.8 | 4.2 |
| NOAA | 22. Mai 2006 | 12–16 | 6–8 | 1–3 |
| Tatsächliche Aktivität | 18 | 10 | 5 | |
Am 22. Mai 2006 gab die NOAA ihre Vorhersagen für die Hurrikansaisonen im Atlantik, Ostpazifik, sowie Zentralpazifik bekannt. In dieser postulierten sie eine leicht unterdurchschnittliche Saison für den Ostpazifikraum mit zwölf bis sechzehn Stürmen, von denen sechs bis acht Hurrikane und eins bis drei schwere Hurrikane werden sollten.[5] Im Zentralpazifik wurden zwei bis drei Stürme erwartet, die entweder in dieses Becken wanderten oder sich dort formten.[6] Diese Aussagen basierten sie auf einen Zirkel von allgemein unterdurchschnittlicher Aktivität während der letzten 10 Jahren. Die Experten erwarteten, dass weder El Niño oder La Niña die Saison beeinflussen würden.[5]
Stürme
Tropischer Sturm Aletta
| Tropischer Sturm | |||
|---|---|---|---|
| |||
| Dauer | 27. Mai – 30. Mai | ||
| Intensität | 40 kn (75 km/h) (1-minütig), 1002 hPa | ||
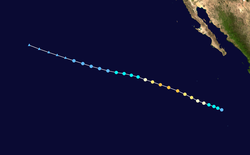
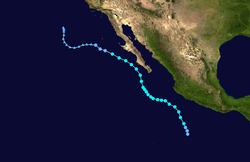
Am 23. Mai, nur acht Tage nach dem Beginn der Saison wurde eine Störung, südsüdwestlich von Acapulco entdeckt. Die Störung begann sich zu organisieren und wurde am Morgen des 27. Mai als erstes tropisches Tiefdruckgebiet der Saison klassifiziert. Später an diesem Tag verstärkte es sich zum tropischen Sturm Aletta. Aletta intensivierte sich zu einem tropischen Sturm mit Windgeschwindigkeiten von 70 km/h, während sie sich auf die Küste von Guerrero zubewegte. Doch später drehte der Sturm in Richtung Westen ab und begann sich stetig abzuschwächen, um sich am 31. Mai aufzulösen. Trotz heftiger Regenfälle in Mexiko wurden weder Schäden, noch Überflutungen gemeldet.[1][2]
- NHC-Archiv zu Tropischer Sturm Aletta (englisch)
- Tropical Cyclone Report zu Tropischer Sturm Aletta (PDF; 127 kB, englisch)
Tropisches Tiefdruckgebiet Zwei-E
| Tropisches Tiefdruckgebiet | |||
|---|---|---|---|
| |||
| Dauer | 3. Juni – 5. Juni | ||
| Intensität | 30 kn (55 km/h) (1-minütig), 1005 hPa | ||
Am 1. Juni entwickelte sich eine tropische Störung, ungefähr an derselben Stelle wie Aletta zuvor. Hohe Windscherung verlangsamte die Entwicklung des Systems, trotzdem konnte es am 3. Juni genug Konvektion und Organisation erlangen, um als tropisches Tiefdruckgebiet klassifiziert zu werden. Das Tiefdruckgebiet verstärkte sich auf fast tropische Sturmstärke, als es sich der Küste des südwestlichen Mexikos näherte, aber Scherung blieb über dem System bestehen und es schwächte sich ab, bis es sich am 4. Juni auflöste. Obwohl es kein benanntes System wurde, fielen in Acapulco 250–300 mm Regen auf Grund von Zwei-E.[7]
Hurrikan Bud
| Kategorie-3-Hurrikan | |||
|---|---|---|---|
| |||
| Dauer | 11. Juli – 16. Juli | ||
| Intensität | 110 kn (205 km/h) (1-minütig), 953 hPa | ||
Nach über einem Monat Inaktivität, begann sich am 10. Juli Ortszeit (11. Juli UTC) eine Störung zu intensivieren, und zum tropischen Tiefdruckgebiet Drei-E aufgestuft. Am 11. Juli, nur sechs Stunden später, verstärkte es sich in den tropischen Sturm Bud. Danach begann sich Bud auf günstigen Bedingungen rasch zu intensivieren. Er entwickelte ein Auge und wurde am Nachmittag des 11. Juli zu einem Hurrikan aufgestuft. Bud intensivierte sich weiter und wurde am 12. Juli zu einem größeren Hurrikan, d. h. ein Hurrikan der Kategorie 3 und stärker. Am 13. Juli erreichte Bud seine Gipfelstärke als ein starker Kategorie-3-Sturm, mit Windgeschwindigkeiten von 205 km/h.[8] Danach bewegte sich Bud über viel kältere Gewässer und schwächte sich schnell ab. Bud degenerierte am 15. Juli zu einem Resttief, ohne jemals Land bedroht zu haben.[8]
- NHC-Archiv zu Hurrikan Bud (englisch)
Hurrikan Carlotta
| Kategorie-1-Hurrikan | |||
|---|---|---|---|
| |||
| Dauer | 12. Juli – 16. Juli | ||
| Intensität | 75 kn (140 km/h) (1-minütig), 981 hPa | ||
Spät am 11. Juli Ortszeit formte sich 400 km südwestlich von Guerrero das vierte tropische Tiefdruckgebiet der Saison. Das Tief intensivierte sich schnell, und nur sechs Stunden später wurde es zum tropischen Sturm Carlotta aufgestuft.[9] Carlotta verstärkte sich weiter und wurde 24 Stunden später ein Hurrikan.[10] Danach bewegte sich Carlotta über ungünstige Bedingungen und kühles Wasser und wurde am 14. Juli zu einem tropischen Sturm abgestuft.[11] Dennoch konnte sich Carlotta noch einmal kurz auf Hurrikanstärke verstärken, doch schwächte sich später ab und degenerierte am 16. Juli zu einem Resttief.
- NHC-Archiv zu Hurrikan Carlotta (englisch)
Hurrikan Daniel
| Kategorie-4-Hurrikan | |||
|---|---|---|---|
| |||
| Dauer | 16. Juli – 26. Juli | ||
| Intensität | 130 kn (240 km/h) (1-minütig), 933 hPa | ||
Am 16. Juli formte sich südlich von Niederkalifornien eine tropische Störung und vermehrte seine konvektive Aktivität und Organisation. Das NHC erklärte es daher zu einem tropischen Tiefdruckgebiet. Das Tief organisierte sich weiter und wurde am nächsten Tag zum tropischen Sturm Daniel ernannt. Daniel intensivierte sich weiter und wurde am 18. Juli zu einem Hurrikan aufgestuft. Daniel begann sich rapide zu intensivieren und erreichte den Status eines größeren Hurrikans (Kategorie 3) und schließlich die Kategorie 4 auf der Saffir-Simpson-Hurrikan-Windskala. Nach einigen Zyklen der Eyewall-Neubildung wurde Daniel ein ringförmiger Hurrikan, was ihm erlaubte seine Intensität länger aufrechtzuerhalten, als es ihm die Bedingungen ermöglicht hätten. Daniel überschritt schließlich am 24. Juli die 140° W Linie und ging daher in das Zentralpazifische Basin über. Zuerst wurde damit gerechnet, dass Daniel Hawaii als tropischer Sturm bedrohen könnte, doch begann Daniel sich zu verlangsamen und er blieb über ungünstigen Bedingungen stehen. Am 26. Juli löste sich Daniel auf, als er noch weit von Hawaii entfernt war.
- NHC-Archiv zu Hurrikan Daniel (englisch)
- CPHC-Archiv zu Hurrikan Daniel (englisch)
Tropischer Sturm Emilia
| Tropischer Sturm | |||
|---|---|---|---|
| |||
| Dauer | 21. Juli – 28. Juli | ||
| Intensität | 55 kn (100 km/h) (1-minütig), 990 hPa | ||
Am 21. Juli formte sich ein tropisches Tiefdruckgebiet und wurde am 22. Juli zum tropischen Sturm Emilia aufgestuft. Zuerst glaubte man, dass Emilia Mexiko bedrohen könnte, doch der Sturm drehte nach Nordwesten ab und bedrohte nun die Halbinsel Niederkalifornien. Emilia brachte der südlichen Spitze von Baja California Sur tropische Sturmwinde, bevor der Sturm nochmals nach Nordwesten abdrehte und über kalten Gewässern schnell schwächer wurde. Zuerst wurde erwartet, dass Emilia Hurrikanstärke erreichen könnte, aber durch die ungünstigen Bedingungen erreichte sie dies nicht. Trotzdem brachte es Emilia auf Windgeschwindigkeiten von 100 km/h.
- NHC-Archiv zu Tropischer Sturm Emilia (englisch)
Tropischer Sturm Fabio
| Tropischer Sturm | |||
|---|---|---|---|
| |||
| Dauer | 31. Juli – 3. August | ||
| Intensität | 45 kn (85 km/h) (1-minütig), 1000 hPa | ||
Am 29. Juli entstand ein Tiefdruckgebiet aus einer tropischen Welle. Diese tropische Störung entwickelte sich bald weiter, aber es dauerte bis zum 31. Juli, bis die gut organisierte tropische Störung ausreichend Konvektion und Organisation aufweisen konnte, um sie zum tropischen Tiefdruckgebiet 7-E aufzustufen. Das Tiefdruckgebiet organisierte sich weiter und wurde sechs Stunden später zum tropischen Sturm Fabio aufgestuft. Der Sturm bewegte sich nach Westen, über offene Gewässer, und konnte sich aufgrund von Windscherung nicht bedeutend verstärken. Fabio schwächte sich am 2. August zu einem tropischen Tiefdruckgebiet ab, und degenerierte am 3. August zu einem Resttief.
- NHC Tropical Cyclone Report zu Tropischer Sturm Fabio (PDF; 184 kB, englisch)
Tropischer Sturm Gilma
| Tropischer Sturm | |||
|---|---|---|---|
| |||
| Dauer | 1. August – 3. August | ||
| Intensität | 35 kn (65 km/h) (1-minütig), 1004 hPa | ||
Am 31. Juli entstand vor der Küste Zentralamerikas das achte tropische Tiefdruckgebiet der Saison. Das Tiefdruckgebiet konnte sich langsam verstärken und wurde am 1. August zum tropischen Sturm Gilma aufgestuft. Gilma schwächte sich jedoch auf Grund hoher Windscherung und trockener Luft ab und wurde am 2. August, nur achtzehn Stunden nachdem es zu einem tropischen Sturm aufgestuft wurde, wieder zu einem tropischen Tiefdruckgebiet herabgestuft. Gilma löste sich schließlich am 3. August auf, ohne jemals Land bedroht zu haben.
- NHC Tropical Cyclone Report zu Tropischer Sturm Wilma (PDF; 148 kB, englisch)
Hurrikan Hector
| Kategorie-2-Hurrikan | |||
|---|---|---|---|
| |||
| Dauer | 15. August – 23. August | ||
| Intensität | 95 kn (175 km/h) (1-minütig), 966 hPa | ||
Am 14. August entwickelte vor der mexikanischen Küste ein Tiefdruckgebiet. Das Tief begann sich zu organisieren und wurde am 15. August zu einem tropischen Tiefdruckgebiet aufgestuft. Das Tief verstärkte sich am 16. August zu einem tropischen Sturm, bevor es sich am 17. August zu einem Hurrikan intensivierte. Das System geriet danach in ein Gebiet mit kälteren Wassertemperaturen und hoher Windscherung und schwächte sich stetig ab, bevor es sich am 22. August auflöste. Hector bedrohte zu keiner Zeit Land.
- NHC-Archiv zu Hurrikan Hector (englisch)
Hurrikan/Taifun Ioke
| Kategorie-5-Hurrikan | |||
|---|---|---|---|
| |||
| Dauer | 20. August – 27. August | ||
| Intensität | 140 kn (260 km/h) (1-minütig), 915 hPa | ||
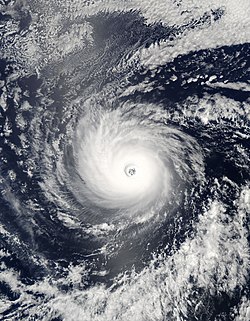
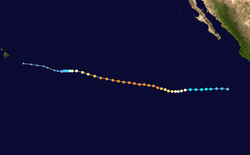
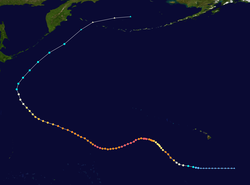
Eine beständige tropische Störung, die in einem Trog eingebettet war, gewann am 19. August Konvektion und entwickelte sich in ein tropisches Tiefdruckgebiet, als es ungefähr 1250 km südlich von Honolulu gelegen war. Das Tiefdruckgebiet verstärkte sich weiter und das Central Pacific Hurricane Center gab dem System den Namen Ioke, dem ersten tropischen Sturm im Zentralpazifik seit 2002. Ioke begann sich schnell zu verstärken und wurde nur 24 Stunden, nachdem es sich gebildet hatte, zu einem Hurrikan aufgestuft. Ioke verstärkte sich weiter und entwickelte sich am 21. August zu einem großen Hurrikan (Kategorie 3+). Später an diesem Tag verstärkte sich Ioke sogar zu einem Kategorie-4-Hurrikan, doch am 22. August begann sich der Sturm abzuschwächen und wurde zu einem Kategorie-2-Sturm herabgestuft. Die östliche Eyewall zog dabei über das unbewohnte Johnston-Atoll[12] an Land und brachte Hurrikanwinde auf die Insel. Am 23. August zog Ioke wieder über zunehmend wärmere Gewässer und der Sturm konnte sich zum zweiten Mal in einen großen Hurrikan verstärken.
Zwölf Menschen an Bord eines USAF-Schiffs mussten aufgrund des nahenden Hurrikans ihr Schiff verlassen und in einen hurrikansicheren Bunker auf dem Johnston-Atoll Unterschlupf suchen.[13] Sie überstanden den Sturm unbeschadet und ein Aufklärungsflugzeug berichtete nur leichte Schäden auf der Insel.[14]
In der Nacht vom 24. zum 25. August verstärkte sich Ioke zu einem Kategorie 5 Hurrikan, dem ersten Hurrikan, der sich im Zentralpazifik gebildet hatte und dort auch diese Intensität erreichte. Ioke schwächte sich dann aufgrund einer Eyewall-Neubildung in einen Kategorie 4 Hurrikan ab, konnte sich aber am 26. August wieder in einen Kategorie 5 Hurrikan verstärken.[15] Als Iokes Zentraldruck auf 915 mbar fiel, wurde er der stärkste Hurrikan, der sich jemals im Zentralpazifik gebildet hat und zurzeit nur der fünfte Kategorie 5 Hurrikan, der jemals im Zentralpazifik existiert hat.
Am 27. August kreuzte der Kategorie 5 Hurrikan die Datumsgrenze und wurde somit zum Taifun Ioke. Kurz darauf schwächte sich der Sturm wieder zu einem Kategorie-4-Taifun ab, konnte aber am 29. August zum dritten Mal Kategorie 5 Stärke erreichen. Nachdem Ioke für weitere 12 Stunde Kategorie 5 Intensität behalten konnte, schwächte sich der Sturm am 30. August zum letzten Mal in einen Kategorie 4 Taifun ab, gerade als er sich Wake Island näherte. Am 1. September passierte der Taifun beinahe genau über Wake, das vor Eintreffen des Sturms evakuiert wurde, und verursachte schwere Schäden. Der Sturm, der aufgrund kühlerer Meerestemperaturen rasch an Stärke verlor, bewegte sich schließlich in Richtung Japan. Am 3. September änderte jedoch ein Trog den Kurs des Taifuns und er bewegte sich in Richtung Norden weg vom Festland. Am 7. September verlor Ioke östlich von Kamtschatka alle seine tropischen Merkmale und wurde für extratropisch erklärt.
- CPHC-Archiv zu Hurrikan Ioke (englisch)
Hurrikan Ileana
| Kategorie-3-Hurrikan | |||
|---|---|---|---|
| |||
| Dauer | 21. August – 27. August | ||
| Intensität | 105 kn (195 km/h) (1-minütig), 955 hPa | ||
Das tropische Tiefdruckgebiet 10-E formte sich am 21. August 520 km südsüdwestlich von Acapulco. Drei Stunden später hatte es sich genug verstärkt, um zu einem tropischen Sturm aufgestuft zu werden. Am 22. August wurde Ileana zu einem Hurrikan aufgestuft und begann sich schnell zu intensivieren. Am 23. August hatte sich Ileana zu einem Hurrikan der Kategorie 3 verstärkt und wurde daher, mit einer Windgeschwindigkeit von über 195 km/h, zum dritten großen Hurrikan der Saison aufgestuft. Danach unterzog sich Ileana einer Eyewall-Neubildung und schwächte sich daher ab.[16] Normalerweise verstärkt sich ein Hurrikan nach so einem Ereignis wieder, doch kaltes Oberflächenwasser hinderten Ileana daran und schwächten ihn noch weiter ab. Am 27. August löste sich der Sturm auf.
- NHC-Archiv zu Hurrikan Ileana (englisch)
Hurrikan John
| Kategorie-4-Hurrikan | |||
|---|---|---|---|
| |||
| Dauer | 28. August – 4. September | ||
| Intensität | 116 kn (215 km/h) (1-minütig), 948 hPa | ||
Am 28. August entwickelte sich ein beständiges Tiefdruckgebiet, das südwestlich von Acapulco gelegen war, in ein tropisches Tiefdruckgebiet. Am selben Tag verstärkte es sich zu einem tropischen Sturm und am 29. August, nur 24 Stunden nachdem es sich entwickelt hatte, in einen Hurrikan. John verstärkte sich sehr schnell und erreichte noch am selben Tag die Kategorie 3 auf der Saffir-Simpson-Hurrikan-Windskala und wurde somit zum 4 großen Hurrikan der Saison. Der Hurrikan konnte sich bis zum 30. August in einen Kategorie 4 Hurrikan verstärken, bis ihn, als er parallel zur Küste Mexikos zog, eine Eyewall-Neubildung und die Nähe zum Land in einen Kategorie-2-Hurrikan abschwächte.[17] Der Sturm konnte sich aber noch einmal zu einem Kategorie 3 Hurrikan verstärken und zog am 1. September als ein Kategorie-2-Hurrikan über Niederkalifornien.[18]
Der Hurrikan brachte Überflutungen über Teile der Westküste Mexikos und Niederkaliforniens. John richtete schwere Schäden an und tötete mindestens sechs Menschen.
- NHC-Archiv zu Hurrikan John (englisch)
Hurrikan Kristy
| Kategorie-1-Hurrikan | |||
|---|---|---|---|
| |||
| Dauer | 30. August – 8. September | ||
| Intensität | 70 kn (130 km/h) (1-minütig), 985 hPa | ||
Am 30. August konnte sich eine tropische Welle, die etwa 845 km südsüdwestlich Niederkalifornien gelegen war, organisieren und wurde somit zum zwölften tropischen Tiefdruckgebiet der Saison aufgestuft. Kurz darauf konnte sich das Tiefdruckgebiet zum tropischen Sturm Kristy verstärken, um sich schließlich am nächsten Tag in einen Hurrikan zu intensivieren. Kristy konnte aber diese Stärke, unter anderem durch die Nähe zu Hurrikan John, nicht lange halten. Kristy schwächte sich stetig ab und löste sich fast auf, ehe sich am 3. September und später am 5. September wieder organisierte Konvektion nahe dem Zentrum konzentrierte und sich das System wieder zu einem tropischen Sturm verstärken konnte. Am 7. September löste sich Kristy in ein Resttief auf.
Aufgrund der Nähe Kristys zum größeren Hurrikan John wirkte sich möglicherweise ein Fujiwhara-Effekt aus, so dass Kristy abgeschwächt wurde und es sah so aus, als ob Kristy eventuell auch durch John absorbiert werden könnte.[19] Letztlich geschah dies nicht.
- NHC-Archiv zu Hurrikan Kristy (englisch)
- The NHC's NHC Tropical Cyclone Report zu Hurrikan Kristy (PDF; 204 kB, englisch)
Hurrikan Lane
| Kategorie-3-Hurrikan | |||
|---|---|---|---|
| |||
| Dauer | 13. September – 17. September | ||
| Intensität | 110 kn (205 km/h) (1-minütig), 952 hPa | ||
Am 13. September konnte sich eine tropische Störung nahe der Küste Mexikos besser organisieren und wurde damit zum dreizehnten tropischen Tiefdruckgebiet der Saison aufgestuft. Das Tief konnte sich unter guten Bedingungen rasch zum tropischen Sturm Lane entwickeln. Der tropische Sturm verursachte schwere Regenfälle und hohe Wellen entlang der Westküste Mexikos, einschließlich Acapulco. Der Sturm konnte sich, während er sich parallel zur Küste Mexikos bewegte, weiter verstärken und wurde am 15. September ein Hurrikan. Am 16. September erreichte er den Status eines großen Hurrikans und gelangte mit dieser Intensität im Bundesstaat Sinaloa an Land. Mindestens vier Menschen starben durch Hurrikan Lane, die Schäden beliefen sich auf ungefähr 110 Millionen US-Dollar.
- NHC-Archiv zu Hurrikan Lane (englisch)
Tropischer Sturm Miriam
| Tropischer Sturm | |||
|---|---|---|---|
| |||
| Dauer | 16. September – 18. September | ||
| Intensität | 40 kn (75 km/h) (1-minütig), 999 hPa | ||
Eine Störung, die mit den nördlichen Ausläufern der ITCZ und einer tropischen Welle verbunden war, entwickelte eine geschlossene Bodenzirkulation und konnte sich am 16. September, trotz des Einflusses des nahen Hurrikan Lane, genug organisieren, um eine Aufstufung in ein Tropisches Tiefdruckgebiet zu rechtfertigen. Das Tief konnte sich rasch verstärken und konnte sich noch am selben Tag in einen tropischen Sturm organisieren. Am 17. September, nach Erreichen der Gipfelstärke von 75 km/h schwächte sich der Sturm wegen starker Windscherung und kalten Ozeantemperaturen rasch ab, und die Zirkulation entfernte sich von der Konvektion. Danach schwächte sich Miriam in ein tropisches Tief ab und degenerierte am 18. September zu einem Resttief. Dieses Resttief löste sich kurz vor der Küste Niederkaliforniens auf, ohne Schäden zu verursachen.
- NHC-Archiv zu Tropischer Sturm Miriam (englisch)
- NHC Tropical Cyclone Report zu Tropischer Sturm Miriam (PDF; 101 kB, englisch)
Tropisches Tiefdruckgebiet Zwei-C
| Tropisches Tiefdruckgebiet | |||
|---|---|---|---|
| |||
| Dauer | 18. September – 20. September | ||
| Intensität | 30 kn (55 km/h) (1-minütig), 1007 hPa | ||
Am 18. September konnte sich eine tropische Störung genug organisieren, um zum zweiten tropischen Tiefdruckgebiet der Saison im Zentralpazifik aufgestuft zu werden. Am 20. September degenerierte das Tiefdruckgebiet zu einem Resttief, ohne sich jemals zum tropischen Sturm verstärkt zu haben.
Tropisches Tiefdruckgebiet Drei-C
| Tropisches Tiefdruckgebiet | |||
|---|---|---|---|
| |||
| Dauer | 26. September – 27. September | ||
| Intensität | 30 kn (55 km/h) (1-minütig), 1007 hPa | ||
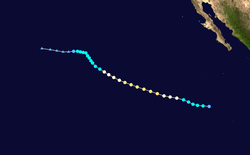
Am 26. September konnte sich eine weitere Störung im Zentralpazifik, nahe der internationalen Datumsgrenze, organisieren und wurde zum dritten tropischen Tiefdruckgebiet der Saison aufgestuft. Die hohe Windscherung verhinderte aber eine weitere Entwicklung und das System löste sich 12 Stunden später auf, gerade als es in den Westpazifik kreuzte.
Tropischer Sturm Norman
| Tropischer Sturm | |||
|---|---|---|---|
| |||
| Dauer | 9. Oktober – 15. Oktober | ||
| Intensität | 45 kn (85 km/h) (1-minütig), 1000 hPa | ||
Anfang Oktober konnte sich ein Tief vor der Küste Mexikos besser organisieren und wurde am 8. Oktober zu einem tropischen Tiefdruckgebiet aufgestuft, da sich die Bodenzirkulation geschlossen hatte. Das System konnte sich über Nacht langsam in einen tropischen Sturm verstärken, doch hohe Windscherung und kalte Meerestemperaturen verhinderten eine weitere Entwicklung. Es begann sich langsam abzuschwächen und verlor am 10. Oktober fast seine ganze Konvektion. Das Resttief Normans vereinigte sich mit einer sich neu entwickelnden tropischen Störung und das System konnte sich reorganisieren. Am 15. Oktober konnte sich Norman unmittelbar vor der Küste Mexikos wieder in ein tropisches Tiefdruckgebiet organisieren und löste sich schließlich auf, nachdem es die Küste erreicht hatte.
- NHC-Archiv zu Tropischer Sturm Norman (englisch)
Tropischer Sturm Olivia
| Tropischer Sturm | |||
|---|---|---|---|
| |||
| Dauer | 9. Oktober – 12. Oktober | ||
| Intensität | 40 kn (75 km/h) (1-minütig), 1000 hPa | ||
- → Hauptartikel: Tropischer Sturm Olivia (2006)
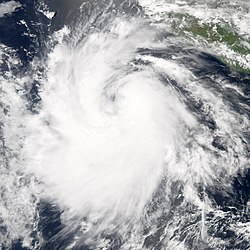
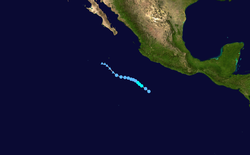
Nur einen Tag nach der Entstehung des späteren tropischen Sturm Normans entwickelte sich, südwestlich von Niederkalifornien, ein neues tropisches Tiefdruckgebiet. Am 10. Oktober konnte sich das System in einen tropischen Sturm verstärken und wurde daher Olivia genannt. Das System geriet jedoch in ein Gebiet mit hoher Windscherung und minimalen Ozeantemperaturen und schwächte sich während des nächsten Tages ab. Am 12. Oktober degenerierte es zu einem Resttief, welches hiernach von der großen tropischen Störung, das mit den Überbleibseln von Norman assoziiert war, aufgesaugt wurde.
- NHC-Archiv zu Tropischer Sturm Olivia (englisch)
- Tropical Cyclone Report zu Tropischer Sturm Olivia (PDF; 394 kB, englisch)
Tropisches Tiefdruckgebiet Vier-C
| Tropisches Tiefdruckgebiet | |||
|---|---|---|---|
| |||
| Dauer | 13. Oktober – 14. Oktober | ||
| Intensität | 30 kn (55 km/h) (1-minütig), 1007 hPa | ||
Ein Gebiet mit erhöhter Gewitteraktivität und Konvektion wurde zuerst am 8. Oktober innerhalb der ITCZ entdeckt. Es konnte sich nur äußerst langsam entwickeln und wurde erst am 13. Oktober in ein tropisches Tiefdruckgebiet aufgestuft, als es ungefähr 1200 km südwestlich von Honolulu gelegen war. Windscherung trennte die Konvektion von der Bodenzirkulation und das System löste sich am 14. Oktober in ein Resttief auf.
- archive on Tropical Depression Four-C (englisch)
Hurrikan Paul
| Kategorie-2-Hurrikan | |||
|---|---|---|---|
| |||
| Dauer | 21. Oktober – 26. Oktober | ||
| Intensität | 90 kn (165 km/h) (1-minütig), 970 hPa | ||
Am 21. Oktober konnte eine tropische Störung, welche schon seit einigen Tagen vor der Küste Mexikos existiert hatte, mehr Konvektion produzieren und wurde daher zu einem tropischen Tiefdruckgebiet aufgestuft. Das System konnte sich schnell verstärken und hatte sich binnen sechs Stunden in einen tropischen Sturm verstärkt. Windscherung von Osten hielt eine weitere Entwicklung auf, doch am 22. Oktober wurden die Bedingungen besser und das System konnte sich stetig in einen Hurrikan verstärken. Paul konnte sich zu einem starken Kategorie-2-Hurrikan verstärken, bevor hohe Scherung und schlechte Bedingungen den Sturm schnell schwächer werden ließen.
Während man anfangs noch erwartete, dass Paul als Hurrikan die Küste erreichen würde, schwächte sich der Sturm schnell, südwestlich von Niederkalifornien gelegen, ab und gelangte in La Reforma am 26. Oktober nur als tropisches Tiefdruckgebiet, wo es sich schnell auflöste.
- NHC-Archiv zu Hurrikane Paul (englisch)
Tropisches Tiefdruckgebiet Achtzehn-E
| Tropisches Tiefdruckgebiet | |||
|---|---|---|---|
| |||
| Dauer | 26. Oktober – 27. Oktober | ||
| Intensität | 30 kn (55 km/h) (1-minütig), 1007 hPa | ||
Gerade als sich Paul abschwächte, wurde vom NHC eine neue tropische Störung nahe der Küste bei Acapulco entdeckt. Die Störung konnte sich am 26. Oktober genug organisieren, um zu einem tropischen Tiefdruckgebiet aufgestuft zu werden. Am 27. Oktober jedoch spaltete sich seine Bodenzirkulation, aufgrund von trockener Luft, südwestlich der Konvektion ab und degenerierte zu einem Resttief.
Tropischer Sturm Rosa
| Tropischer Sturm | |||
|---|---|---|---|
| |||
| Dauer | 8. November – 10. November | ||
| Intensität | 35 kn (65 km/h) (1-minütig), 1002 hPa | ||
- → Hauptartikel: Tropischer Sturm Rosa (2006)
Am 6. November wurde eine tropische Störung vor der Zentralamerikanischen Pazifikküste bemerkt. Als sie sich in Richtung Westen bewegte, entwickelte sich ein Tief auf der Störung und das System wurde am 8. November zu einem tropischen Tiefdruckgebiet aufgestuft, dem ersten November-Sturm seit 2002.[20] Das Tiefdruckgebiet musste sich gegen vertikale Windscherung behaupten und verstärkte sich schließlich am 9. November in einen tropischen Sturm. Doch noch am selben Tag schwächte sich Rosa, wegen zu hoher Windscherung, wieder in ein tropisches Tiefdruckgebiet ab. Am 10. November degenerierten die Überbleibsel Rosas zu einem breiten Tief.
- NHC-Archiv zu Tropischer Sturm Rosa (englisch)
Tropisches Tiefdruckgebiet Zwanzig-E
| Tropisches Tiefdruckgebiet | |||
|---|---|---|---|
| |||
| Dauer | 11. November – 11. November | ||
| Intensität | 30 kn (55 km/h) (1-minütig), 1007 hPa | ||
Am 11. November konnte sich ein kleines, aber gut definiertes Tief, ungefähr 1130 km südsüdwestlich von Niederkalifornien, in ein tropisches Tiefdruckgebiet entwickeln. Am nächsten Tag jedoch degenerierte das System zu einem offenen Trog.
Hurrikan Sergio
| Kategorie-2-Hurrikan | |||
|---|---|---|---|
| |||
| Dauer | 13. November – 20. November | ||
| Intensität | 95 kn (175 km/h) (1-minütig), 965 hPa | ||
Wenige Tage nachdem das tropische Tiefdruckgebiet 20-E zu einem offenen Trog degenerierte, konnte sich ein Gebiet mit niedriger Bewölkung in ein tropisches Tiefdruckgebiet entwickeln, nachdem es tiefe Konvektion für längere Zeit aufrechterhalten konnte. Nur zehn Stunden später konnte sich das Tiefdruckgebiet in einen tropischen Sturm verstärken. Es war erst das erste Mal seit 1961, dass sich zwei benannte Stürme im Nordostpazifik im November bildeten.[21] Das System konnte sich weiter verstärken und wurde am 15. November zu einem Hurrikan aufgestuft, dem ersten pazifischen November-Hurrikan seit 2001 (Octave: 31. Oktober bis 3. November 2001) und der erste, der sich in diesem Monat seit 1997[20] geformt hatte. Das System konnte sich zu einem starken Kategorie-2-Hurrikan verstärken und als sein Zentraldruck auf 965 mbar fiel, wurde Sergio der stärkste pazifische November-Hurrikan überhaupt.[22] Der Sturm driftete langsam in Richtung Norden, wobei er sich aufgrund von Windscherung langsam abschwächte. Am 17. November hatte sich Sergio wieder in einen tropischen Sturm abgeschwächt und die Bodenzirkulation trennte sich von der Konvektion.[23] Am 18. November konnte der Sturm jedoch erneut tiefe Konvektion erzeugen und wurde wieder stärker. Diese Entwicklung hielt aber nicht lange an und Sergio schwächte sich wieder ab und löste sich 20. November endgültig auf, wobei er der langlebigste ostpazifische tropische Wirbelsturm im November seit Beginn der systematischen Beobachtungen wurde.[24]
- NHC-Archiv zu Hurrikan Sergio (englisch)
Andere Stürme
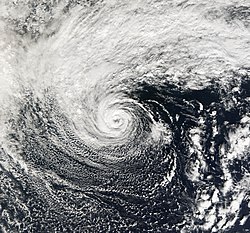
Ende Oktober existierte ein extratropischer Sturm ganz im Norden des zentralpazifischen Ozeans. Der Sturm bewegte sich über außerordentlich warme Gewässer (2 °C über dem Durchschnitt) und konnte langsam Konvektion nahe dem Zentrum aufbauen. Am 2. November wurden mittels Satellitenschätzungen Windgeschwindigkeiten von 95 km/h inmitten des Sturm gemessen, während der Sturm etwa 1450 km westlich von Oregon gelegen war. Der Sturm konnte auch ein klares Auge und eine Eyewall ausbilden.[25] Der Sturm bewegte sich danach in nordöstliche Richtung und schwächte sich ab, bevor er sich am 4. November auflöste.
Die NASA beschrieb diesen Sturm als subtropisch. Doch aufgrund der äußerst seltenen Lage war der Sturm außerhalb des Zuständigkeitsbereichs eines Hurrikan-Vorhersagezentrums, weswegen er auch nicht benannt wurde. Operativ wurde das System von der US-Navy wie eine tropische Störung behandelt und mit 91C nummeriert.[25]
Platzierung nach Accumulated Cyclone Energy (ACE)
| ACE (104kt2) | |||||||||||||
|---|---|---|---|---|---|---|---|---|---|---|---|---|---|
| 1 | (32,2) | Ioke | 11 | 4,75 | Kristy | ||||||||
| 2 | 27,3 (2,25) | Daniel | 12 | 4,58 | Emilia | ||||||||
| 3 | 18,3 | John | 13 | 1,34 | Fabio | ||||||||
| 4 | 12,1 | Ileana | 14 | 1,13 | Aletta | ||||||||
| 5 | 12,0 | Hector | 15 | 0,970 | Miriam | ||||||||
| 6 | 8,98 | Bud | 16 | 0,768 | Norman | ||||||||
| 7 | 8,00 | Sergio | 17 | 0,725 | Olivia | ||||||||
| 8 | 6,80 | Lane | 18 | 0,368 | Gilma | ||||||||
| 9 | 6,06 | Paul | 19 | 0,368 | Rosa | ||||||||
| 10 | 6,03 | Carlotta | |||||||||||
| Total: 120 (34,5) | |||||||||||||
Die nebenstehende Tabelle zeigt den ACE für jeden Sturm dieses Jahres. Der ACE beschreibt die Energie eines tropischen Sturms, indem die Stärke eines Sturms mit der Dauer multipliziert wird, das heißt langandauernde Stürme, sowie starke Stürme haben einen hohen ACE-Wert.
Werte, die in Klammern geschrieben sind, beschreiben den ACE-Wert im zentralpazifischen Becken, während die Zahlen ohne Klammern die Werte der Stürme im Ostpazifik verdeutlichen.
Saisonübersicht
Einzelnachweise
- ↑ a b National Hurricane Center, NOAA: May Tropical Weather Summary (Englisch). National Oceanic and Atmospheric Administration, 1. Juni 2006, abgerufen am 1. Juni 2006.
- ↑ a b National Hurricane Center: Tropical Cyclone Report: Tropischer Sturm Aletta. (PDF; 130 kB) NOAA, 2006, abgerufen am 18. Juli 2006.
- ↑ Comisión Federal de Electricidad: Aviso 12 de la Depresión Tropical 2-E (Spanisch). CFE, 4. Juni 2006, archiviert vom am 24. September 2008; abgerufen am 7. Juni 2006. Info: Der Archivlink wurde automatisch eingesetzt und noch nicht geprüft. Bitte prüfe Original- und Archivlink gemäß Anleitung und entferne dann diesen Hinweis.
- ↑ Climate Prediction Center, NOAA: Background Information: East Pacific Hurricane Season. National Oceanic and Atmospheric Administration, 22. Mai 2006, abgerufen am 24. Mai 2006 (englisch).
- ↑ a b Climate Prediction Center, NOAA: NOAA Expects Below Average 2006 East Pacific Hurricane Season. National Oceanic and Atmospheric Administration, 22. Mai 2006, archiviert vom am 6. Oktober 2013; abgerufen am 22. Mai 2006 (englisch). Info: Der Archivlink wurde automatisch eingesetzt und noch nicht geprüft. Bitte prüfe Original- und Archivlink gemäß Anleitung und entferne dann diesen Hinweis.
- ↑ Central Pacific Hurricane Center, NOAA: NOAA Announces Central Pacific Hurricane Season Outlook. National Oceanic and Atmospheric Administration, 22. Mai 2006, archiviert vom am 6. Oktober 2013; abgerufen am 10. Juni 2006 (englisch). Info: Der Archivlink wurde automatisch eingesetzt und noch nicht geprüft. Bitte prüfe Original- und Archivlink gemäß Anleitung und entferne dann diesen Hinweis.
- ↑ Comisión Federal de Electricidad: Aviso 12 de la Depresión Tropical 2-E (Spanisch). CFE, 4. Juni 2006, archiviert vom am 24. September 2008; abgerufen am 7. Juni 2006. Info: Der Archivlink wurde automatisch eingesetzt und noch nicht geprüft. Bitte prüfe Original- und Archivlink gemäß Anleitung und entferne dann diesen Hinweis.
- ↑ a b Alberto Hernández Unzón: Resúmen del Huracán Bud del Océano Pacífico (Spanisch). Servicio Meteorologico Nacional, Comisión Nacional del Agua, archiviert vom am 21. September 2006; abgerufen am 9. September 2006. Info: Der Archivlink wurde automatisch eingesetzt und noch nicht geprüft. Bitte prüfe Original- und Archivlink gemäß Anleitung und entferne dann diesen Hinweis.
- ↑ National Hurricane Center: Tropical Storm Carlotta Discussion Number 2, 02.00 Uhr PDT, 12 Juli, 2006 (Englisch). National Oceanic and Atmospheric Administration, ehemals im (nicht mehr online verfügbar); abgerufen am 12. Juli 2006. (Seite nicht mehr abrufbar. Suche in Webarchiven) Info: Der Link wurde automatisch als defekt markiert. Bitte prüfe den Link gemäß Anleitung und entferne dann diesen Hinweis.
- ↑ National Hurricane Center: Tropical Storm Carlotta Discussion Number 6, 02:00 Uhr PDT, 13. Juli, 2006 (Englisch). National Oceanic and Atmospheric Administration, ehemals im (nicht mehr online verfügbar); abgerufen am 13. Juli 2006. (Seite nicht mehr abrufbar. Suche in Webarchiven) Info: Der Link wurde automatisch als defekt markiert. Bitte prüfe den Link gemäß Anleitung und entferne dann diesen Hinweis.
- ↑ National Hurricane Center: Tropical Storm Carlotta Discussion Number 12, 14:00 Uhr PDT, 14. Juli, 2006 (Englisch). National Oceanic and Atmospheric Administration, ehemals im (nicht mehr online verfügbar); abgerufen am 14. Juli 2006. (Seite nicht mehr abrufbar. Suche in Webarchiven) Info: Der Link wurde automatisch als defekt markiert. Bitte prüfe den Link gemäß Anleitung und entferne dann diesen Hinweis.
- ↑ Central Pacific Hurricane Center: Hurricane Ioke Discussion Number 14…Corrected (Englisch). National Oceanic and Atmospheric Administration, 22. August 2006, archiviert vom am 29. September 2006; abgerufen am 24. August 2006. Info: Der Archivlink wurde automatisch eingesetzt und noch nicht geprüft. Bitte prüfe Original- und Archivlink gemäß Anleitung und entferne dann diesen Hinweis.
- ↑ Leone, Diana: Hawaiian-named storm hits Johnston Isle. Star Bulletin, 23. August 2006, abgerufen am 25. August 2006 (englisch).
- ↑ Gima, Craig: 12 survive hurricane at Johnston Atoll (Englisch). Star Bulletin, 24. August 2006, archiviert vom am 19. Oktober 2007; abgerufen am 25. August 2006. Info: Der Archivlink wurde automatisch eingesetzt und noch nicht geprüft. Bitte prüfe Original- und Archivlink gemäß Anleitung und entferne dann diesen Hinweis.
- ↑ Central Pacific Hurricane Center: Hurricane Ioke Discussion Number 26 (Englisch). National Oceanic and Atmospheric Administration, 25. August 2006, archiviert vom am 29. September 2006; abgerufen am 27. August 2006. Info: Der Archivlink wurde automatisch eingesetzt und noch nicht geprüft. Bitte prüfe Original- und Archivlink gemäß Anleitung und entferne dann diesen Hinweis.
- ↑ National Hurricane Center: Hurricane Ileana Discussion Number 12. National Oceanic and Atmospheric Administration, ehemals im (nicht mehr online verfügbar); abgerufen am 25. August 2006 (englisch). (Seite nicht mehr abrufbar. Suche in Webarchiven) Info: Der Link wurde automatisch als defekt markiert. Bitte prüfe den Link gemäß Anleitung und entferne dann diesen Hinweis.
- ↑ Mainelli/Pasch: Hurricane John Discussion Fourteen (Englisch). NHC, 2006, ehemals im (nicht mehr online verfügbar); abgerufen am 31. August 2006. (Seite nicht mehr abrufbar. Suche in Webarchiven) Info: Der Link wurde automatisch als defekt markiert. Bitte prüfe den Link gemäß Anleitung und entferne dann diesen Hinweis.
- ↑ Beven: Hurricane John Discussion Nineteen (Englisch). NHC, 2006, ehemals im (nicht mehr online verfügbar); abgerufen am 2. September 2006. (Seite nicht mehr abrufbar. Suche in Webarchiven) Info: Der Link wurde automatisch als defekt markiert. Bitte prüfe den Link gemäß Anleitung und entferne dann diesen Hinweis.
- ↑ Central Pacific Hurricane Center: Hurricane Kristy Discussion Number 6. National Oceanic and Atmospheric Administration, 31. August 2006, ehemals im (nicht mehr online verfügbar); abgerufen am 30. November 2008. (Seite nicht mehr abrufbar. Suche in Webarchiven) Info: Der Link wurde automatisch als defekt markiert. Bitte prüfe den Link gemäß Anleitung und entferne dann diesen Hinweis.
- ↑ a b National Hurricane Center: NHC/TPC Archive of Hurricane Seasons (Englisch). NOAA, archiviert vom am 8. August 2008; abgerufen am 11. November 2006. Info: Der Archivlink wurde automatisch eingesetzt und noch nicht geprüft. Bitte prüfe Original- und Archivlink gemäß Anleitung und entferne dann diesen Hinweis.
- ↑ http://www.nhc.noaa.gov/archive/2006/ep21/ep212006.discus.003.shtml
- ↑ http://www.nhc.noaa.gov/archive/2006/ep21/ep212006.discus.010.shtml?
- ↑ http://www.nhc.noaa.gov/archive/2006/ep21/ep212006.discus.017.shtml
- ↑ http://www.nhc.noaa.gov/archive/2006/ep21/ep212006.discus.029.shtml
- ↑ a b Archivierte Kopie ( des vom 26. Oktober 2008 im Internet Archive) Info: Der Archivlink wurde automatisch eingesetzt und noch nicht geprüft. Bitte prüfe Original- und Archivlink gemäß Anleitung und entferne dann diesen Hinweis.
Weblinks
- NRL Monterey Marine Meteorology Division: Gute Übersicht von Hurrikanereignissen und Dokumentationen
- National Hurricane Center: Offizielle Seite der National Oceanic and Atmospheric Administration (NOAA)
- Central Pacific Hurricane Center: Offizielle Seite der National Oceanic and Atmospheric Administration (NOAA)
Auf dieser Seite verwendete Medien
This image shows Hurricane Ileana in the Pacific Ocean as captured by the MODIS instrument on NASA's Terra satellite on August 23. At 1750 UTC, Ileana's maximum sustained winds were 120 mph and its minimum central pressure was 955 mb.
Track map of Hurricane Carlotta of the 2006 Pacific hurricane season. The points show the location of the storm at 6-hour intervals. The colour represents the storm's maximum sustained wind speeds as classified in the (see below), and the shape of the data points represent the nature of the storm, according to the legend below.
Storm type
This image of Tropical Storm Norman was captured by the MODIS instrument on NASA's Terra satellite at 1849 UTC on October 9, 2006 when it was located in the eastern Pacific Ocean. At the time, maximum sustained winds were 45 mph and the minimum pressure was approximately 1002 mb.
Track map of Tropical Depression Three-C of the 2006 Pacific hurricane season. The points show the location of the storm at 6-hour intervals. The colour represents the storm's maximum sustained wind speeds as classified in the (see below), and the shape of the data points represent the nature of the storm, according to the legend below.
Storm type
Track map of Tropical Storm Olivia of the 2006 Pacific hurricane season. The points show the location of the storm at 6-hour intervals. The colour represents the storm's maximum sustained wind speeds as classified in the (see below), and the shape of the data points represent the nature of the storm, according to the legend below.
Storm type
Hurricane Ioke started as all tropical cyclones do, as a depression—an area of low atmospheric pressure. After forming August 19, 2006, the depression quickly developed into a tropical storm, the threshold for earning a name. Ioke is the Hawaiian word for the name “Joyce.” Storms and hurricanes in the central Pacific are unusual, but they occur often enough for there to be a naming convention, applied by the Central Pacific Hurricane Center in Honolulu. The last named central Pacific storm was Huko in 2002. Ioke rose all the way to hurricane strength in less than 24 hours.
Hurricane Ioke at the time of this image had a well-defined round shape, clear spiral-arm structure, and a distinct but cloud-filled (or “closed”) eye. The University of Hawaii’s Tropical Storm Information Center reported that Hurricane Ioke had sustained winds of around 255 kilometers per hour (160 miles per hour) at the time this satellite image was acquired.Track map of Tropical Depression Twenty-E of the 2006 Pacific hurricane season. The points show the location of the storm at 6-hour intervals. The colour represents the storm's maximum sustained wind speeds as classified in the (see below), and the shape of the data points represent the nature of the storm, according to the legend below.
Storm type
Hurricane Hector formed in the eastern Pacific on August 15, 2006. Within a day, it had become organized enough to be classified as a tropical storm and earn its name. As of August 18, Hector was a moderately powerful Category 2 hurricane, traveling across the eastern Pacific. At that time, it was not expected to develop much additional power or to make landfall.
This photo-like image was acquired by the Moderate Resolution Imaging Spectroradiometer (MODIS) on the Terra satellite on August 17, 2006, at 10:30 a.m. local time (18:30 UTC). Hurricane Hector at the time of this image was a large and well-developed system. The storm had a closed (cloud-filled) but clearly defined eye, with a distinct eyewall. Hurricane Hector had sustained winds of around 160 kilometers per hour (100 miles per hour), according to the University of Hawaii’s Tropical Storm Information Center.Tropical Storm Agatha of the 2010 Pacific hurricane season on May 29, 2010 soon after being upgraded to a tropical storm.
Hurricane Sergio was spinning off the coast of Mexico on the morning of November 15, 2006. Sergio was the tenth hurricane in the Eastern Pacific in 2006. When Sergio first reached tropical storm status on November 13, it broke a record set in 1961, the last time more than one tropical storm formed in the Eastern Pacific in November, according to the National Hurricane Center. Tropical Storm Rosa formed in the Eastern Pacific earlier in November 2006. While the hurricane season officially runs until the end of November, late storms are unusual. Only five other storms on record have formed later in the season than Sergio. It is also unusual for tropical storms that form this late in the season to intensify all the way to hurricane strength as Sergio had done.
This photo-like image of Hurricane Sergio was acquired by the Moderate Resolution Imaging Spectroradiometer (MODIS) on the Terra satellite on November 15, 2006 at 17:25 UTC (10:25 a.m. local time). At this time, Sergio was a well-defined spiral ball of clouds with a distinct central eye and cloudwall around the eye. Peak sustained winds were 165 kilometers per hour (105 miles per hour), according to the University of Hawaii’s Tropical Storm Information Center, making Sergio a Category Two strength hurricane.
Terra MODIS saw the storm very near its peak strength. It continued to intensify slightly for a short while after MODIS obtained this image. But within hours, wind shear began to pull apart the neat organization of the storm, robbing it of power.Track map of Tropical Storm Miriam of the 2006 Pacific hurricane season. The points show the location of the storm at 6-hour intervals. The colour represents the storm's maximum sustained wind speeds as classified in the (see below), and the shape of the data points represent the nature of the storm, according to the legend below.
Storm type
Track map of Hurricane John of the 2006 Pacific hurricane season. The points show the location of the storm at 6-hour intervals. The colour represents the storm's maximum sustained wind speeds as classified in the (see below), and the shape of the data points represent the nature of the storm, according to the legend below.
Storm type
Tropical Storm Emilia skirted the coast of Baja California as it moved northwest into the Pacific Ocean on July 26, 2006. When the Moderate Resolution Imaging Spectroradiometer (MODIS) on NASA’s Aqua satellite captured this image at 1:35 p.m. Pacific Daylight Time (20:25 UTC), the storm had sustained winds of 100 kilometers per hour (65 miles per hour) with stronger gusts. Though these winds were still about ten miles per hour under hurricane status, Emilia has the distinct spiraling clouds and round shape that mark a hurricane. In the hours after this image was taken, Emilia moved out over the Pacific Ocean and degraded into a tropical depression, said the National Hurricane Center.
The large image provided above is at MODIS’ maximum resolution of 250 meters per pixel. The image is available in additional resolutions from the MODIS Rapid Response Team.Track map of Hurricane Lane of the 2006 Pacific hurricane season. The points show the location of the storm at 6-hour intervals. The colour represents the storm's maximum sustained wind speeds as classified in the (see below), and the shape of the data points represent the nature of the storm, according to the legend below.
Storm type
Satellite image of Tropical Depression Two-E near the southwest Mexican coast
This image shows Hurricane John off the coast of Southern Baja California, just four hours before it made its first landfall in Cabo del Este. It was captured by the MODIS instrument on NASA's Aqua satellite on September 1 at 2055 UTC. John's maximum sustained winds were observed at 110 mph and its minimum central pressure at 958 mb.
Hurrikan Lane vor der Küste Mexikos
Track map of Tropical Depression Two-E of the 2006 Pacific hurricane season. The points show the location of the storm at 6-hour intervals. The colour represents the storm's maximum sustained wind speeds as classified in the (see below), and the shape of the data points represent the nature of the storm, according to the legend below.
Storm type
Track map of Tropical Storm Fabio of the 2006 Pacific hurricane season. The points show the location of the storm at 6-hour intervals. The colour represents the storm's maximum sustained wind speeds as classified in the (see below), and the shape of the data points represent the nature of the storm, according to the legend below.
Storm type
MODIS satellite image of Tropical Depression 03C (2006), on September 26, 2006.
This image shows Tropical Storm Fabio (2006) in the Pacific Ocean at 2135 UTC on August 1, 2006
This image of Tropical Storm Olivia was captured by the MODIS instrument on NASA's Aqua satellite at 2155 UTC on October 9, 2006 when it was located in the eastern Pacific Ocean. At the time, maximum sustained winds were 45 mph and the minimum pressure was approximately 1000 mb.
Track map of Hurricane Kristy of the 2006 Pacific hurricane season. The points show the location of the storm at 6-hour intervals. The colour represents the storm's maximum sustained wind speeds as classified in the (see below), and the shape of the data points represent the nature of the storm, according to the legend below.
Storm type
As of September 1, 2006, Hurricane John had been lashing the Mexican Pacific coast for several days. The storm system center was remaining offshore and predictions held that it would only briefly come ashore as it clipped the southern tip of Mexico’s Baja California on its track up along the Pacific coast. It is unusual for a eastern Pacific hurricane to come ashore without breaking apart into a lesser storm system because of prevailing wind patterns and cold water upwelling along the coast. Hurricane John, however, has managed to run parallel to the Mexican coast for several days. The most powerful hurricane force winds were not over land, but the Category Four hurricane was large enough to bring strong winds and heavy surf to the coastal areas.
This photo-like image was acquired by the Moderate Resolution Imaging Spectroradiometer (MODIS) on the Aqua satellite on August 31, 2006, at 2:10 p.m. local time (20:10 UTC). Hurricane John at the time of this image had a well-defined, if widespread, shape, spiral arm structure, and a cloud-filled (“closed”) eye. Hurricane John had sustained winds of around 165 kilometers per hour (105 miles per hour) at the time this satellite image was acquired, according to The University of Hawaii’s Tropical Storm information center. This was somewhat less powerful than two days earlier, when Category Four strength winds were measured in the central parts of the hurricane.Hurricane Bud formed in the eastern Pacific on July 10, 2006, off the Pacific coast of Mexico. The tropical depression gathered power and size rapidly as it traveled northwest over the next several days, roughly parallel to, but well away from, the Mexican coast. The tropical depression was upgraded to tropical storm status and given the name Bud around midnight (local time) on July 11, and Bud was upgraded again to hurricane status only a few hours later. After a brief hiccup when it lost power and slipped back to tropical storm status, Bud intensified over subsequent days, reaching Category Three status on the Saffir-Simpson Hurricane Scale by the morning of July 13.
This photo-like image was acquired by the Moderate Resolution Imaging Spectroradiometer (MODIS) on the Terra satellite on July 12, 2006, at 12:55 p.m. local time (18:55 UTC). The hurricane was quite compact, but had a well-defined spiral structure and a distinct eye. Sustained winds in the storm system were estimated to be around 160 kilometers per hour (100 miles per hour) around the time the image was captured, according to the University of Hawaii’s Tropical Storm Information Center.With winds near 240 kilometers per hour (150 miles per hour or 130 knots), Hurricane Daniel was a powerful and dangerous storm when the Moderate Resolution Imaging Spectroradiometer (MODIS) on NASA’s Aqua satellite captured this image on July 21, 2006, over the Eastern Pacific Ocean. Daniel has tightly spiraling clouds that circle an open eye with near-perfect symmetry: hallmarks of a well-organized storm. At the time, 2:55 p.m. Pacific Daylight Time (21:55 UTC), Daniel was a strong Category 4 storm, its winds just a few knots short of a Category 5 storm. The Central Pacific Hurricane Center predicted that the storm would move slowly northwest, gradually degrading into a tropical storm before hitting the island of Hawaii on July 28.
The large image provided above has a resolution of 250 meters per pixel.TS Miriam of 2006.
Track map of Tropical Depression Four-C of the 2006 Pacific hurricane season. The points show the location of the storm at 6-hour intervals. The colour represents the storm's maximum sustained wind speeds as classified in the (see below), and the shape of the data points represent the nature of the storm, according to the legend below.
Storm type
This image of Tropical Depression 4C was captured by the MODIS instrument on NASA's Terra satellite at 2143 UTC on October 13, 2006 when it was located in the Centrel Pacific Ocean. At the time, maximum sustained winds were 35 mph and the minimum pressure was approximately 1007 mb.
Track map of Hurricane Ioke of the 2006 Pacific hurricane season and the 2006 Pacific typhoon season. The points show the location of the storm at 6-hour intervals. The colour represents the storm's maximum sustained wind speeds as classified in the (see below), and the shape of the data points represent the nature of the storm, according to the legend below.
Storm type
Tropical Storm Aletta formed off the Pacific coast of southern Mexico on May 27, 2006, as a tropical depression. Over the next day, it gained a little strength until it reached tropical storm status, with sustained winds of around 62 kilometers per hour (39 miles per hour). Aletta never built much beyond this strength before slipping back below storm strength to be a tropical depression on May 30. Aletta stayed offshore, which often happens with cyclones that form in the Eastern Pacific. However, Aletta did get to grab the tiara of the first named storm in the Eastern Pacific of the 2006 hurricane season.
This photo-like image was acquired by the Moderate Resolution Imaging Spectroradiometer (MODIS) on NASA’s Aqua satellite on May 27, 2006, at 3:05 p.m. local time (20:05 UTC). The tropical storm did have a discernable spiral structure in this satellite image, but other evidence of a well-developed storm system, such as an eye structure and tightly wound spiral arms, are absent. Sustained winds in the storm system were estimated to be around 65 kilometers per hour (40 miles per hour) around the time the image was captured, according to the University of Hawaii’s Tropical Storm Information Center.Track map of Tropical Depression Two-C of the 2006 Pacific hurricane season. The points show the location of the storm at 6-hour intervals. The colour represents the storm's maximum sustained wind speeds as classified in the (see below), and the shape of the data points represent the nature of the storm, according to the legend below.
Storm type
Track map of Tropical Depression Eighteen-E of the 2006 Pacific hurricane season. The points show the location of the storm at 6-hour intervals. The colour represents the storm's maximum sustained wind speeds as classified in the (see below), and the shape of the data points represent the nature of the storm, according to the legend below.
Storm type
Track map of Hurricane Sergio of the 2006 Pacific hurricane season. The points show the location of the storm at 6-hour intervals. The colour represents the storm's maximum sustained wind speeds as classified in the (see below), and the shape of the data points represent the nature of the storm, according to the legend below.
Storm type
Track map of Tropical Storm Aletta of the 2006 Pacific hurricane season. The points show the location of the storm at 6-hour intervals. The colour represents the storm's maximum sustained wind speeds as classified in the (see below), and the shape of the data points represent the nature of the storm, according to the legend below.
Storm type
Tropical storms, as their name suggest, tend to form in the tropics. However, from time to time similar looking storms can form at higher latitudes. Extratropical storms have cold rather than warm cores and usually form their characteristic spiral shape when two fronts collide. More rare are polar lows, a similar storm system which can form in the Arctic. On very rare occasions, however, there are peculiar hybrid storms with some of the characteristics of a tropical storm and some characteristics of an extratropical storm. The terminology to describe them becomes potentially confusing. One name given to such storms is subtropical storms.
This photo-like image of a subtropical storm was acquired by the Moderate Resolution Imaging Spectroradiometer (MODIS) on the Terra satellite on November 1, 2006. Located 900 miles off the coast of Oregon in the northwestern Pacific, this storm system looks like a hurricane, but it is located far from any of the typical hurricane formation areas. The storm originally formed from a cold-cored extratropical storm, but after sending two days over anomalously warm water, it developed a warm center and the hurricane characteristics of a cloud-free eye and an eyewall of thunderstorms circling the eye. Though the storm was strong enough to be named had it formed in one of the hurricane sectors, it is outside the regions which hurricane monitoring organizations administer, so the authority to give it a full name is not well defined. As of November 2, 2006, the Central Pacific Hurricane Center in Honolulu had not issued any information on the storm nor even applied it with a name. It was known merely as Storm 91C by the U.S. Navy.Track map of Hurricane Paul of the 2006 Pacific hurricane season. The points show the location of the storm at 6-hour intervals. The colour represents the storm's maximum sustained wind speeds as classified in the (see below), and the shape of the data points represent the nature of the storm, according to the legend below.
Storm type
Hurricane Carlotta formed in the eastern Pacific on July 11, 2006, off the Pacific coast of Mexico. The tropical depression gradually gathered power and size as it traveled northwest over the next several days, roughly parallel to, but well away from, the Mexican coast. The tropical depression was upgraded to tropical storm status and given the name Carlotta on July 12, and the storm was upgraded again to hurricane status the morning of the next day. Forecasts as of July 13 predicted that Carlotta would continue to intensify and track west to northwest without making landfall or posing any significant threat to land. The track of the hurricane roughly mimics that of Hurricane Bud nearby, which formed a day earlier and was also tracking west out to sea.
This photo-like image was acquired by the Moderate Resolution Imaging Spectroradiometer (MODIS) on the Aqua satellite on July 12, 2006, at 2:20 p.m. local time (20:20 UTC). The tropical storm had a developing spiral structure in this image, hinting that its intensity was climbing towards the hurricane status it achieved some 12 hours later. Sustained winds in the storm system were estimated to be around 100 kilometers per hour (55 miles per hour) around the time the image was captured, according to the University of Hawaii’s Tropical Storm Information Center.Track map of Tropical Storm Gilma of the 2006 Pacific hurricane season. The points show the location of the storm at 6-hour intervals. The colour represents the storm's maximum sustained wind speeds as classified in the (see below), and the shape of the data points represent the nature of the storm, according to the legend below.
Storm type
Hurricane Paul formed on October 21, 2006, in the eastern Pacific near the coast of Mexico. It grew quickly to hurricane strength as it spun off the coast near Baja California for the next several days. The sixteenth named storm of the Pacific storm system, Paul remained offshore and never seriously threatened any major land structures, though residents of southern Baja California were eyeing it warily for signs it might shift and come ashore there.
This photo-like image was acquired by the Moderate Resolution Imaging Spectroradiometer (MODIS) on the Aqua satellite on October 23 2006, at 12:30 p.m. local time (20:30 UTC). Paul at the time of this image was a small well-defined spiral swirl which was no longer considered a threat to Baja California. However beyond the tightly wound hurricane, this image shows very wide cloud structures loosely shaped around the storm suggestive that the hurricane was having far reaching effects beyond its immediate reach, with heavy cloud structures extended far offshore as well as over southern Baja. Winds around the center of Hurricane Paul were whipping around at 160 kilometers per hour (100 miles per hour) according to the University of Hawaii’s Tropical Storm Information Center.
In 2005, the record-breaking Atlantic hurricane season was the focus of attention, with the number of named storms exhausting the letters of the alphabet. But as of late October 2006, the hurricane activity in the eastern Pacific Ocean was outpacing the Atlantic: 16 named storms (9 of them hurricanes) versus 9 named storms (5 of them hurricanes). On average, the eastern Pacific Ocean experiences more tropical storms and hurricanes than the Atlantic Basin, 16.4 compared to 10.1. Powerful hurricanes in the eastern Pacific rarely make landfall in the western United States. Persistent easterly winds not only tend to steer storms away from the coast, but they also “shove” the ocean’s surface water westward, away from the coast, allowing cool water to well up to replace it. The cool water weakens any storms that do approach the coast.This image of Hurricane Kristy was captured by the MODIS instrument on NASA's Terra satellite at 1843 UTC on August 31, 2006 when it was located in the eastern Pacific Ocean. At the time, maximum sustained winds were 75 mph and the minimum pressure was approximately 987 mb.
Track map of Hurricane Ileana of the 2006 Pacific hurricane season. The points show the location of the storm at 6-hour intervals. The colour represents the storm's maximum sustained wind speeds as classified in the (see below), and the shape of the data points represent the nature of the storm, according to the legend below.
Storm type
2006's Tropical Depression 02C at peak strength. Cropped from original image
This image shows Tropical Storm Gilma (2006) in the Pacific Ocean at 1800 UTC on August 1, 2006
Track map of Hurricane Daniel of the 2006 Pacific hurricane season. The points show the location of the storm at 6-hour intervals. The colour represents the storm's maximum sustained wind speeds as classified in the (see below), and the shape of the data points represent the nature of the storm, according to the legend below.
Storm type
This image shows Tropical Depression 18-E off the southern coast of Mexico as captured by the MODIS instrument on NASA's Terra satellite on October 26. At 1755 UTC, 18-E's maximum sustained winds were observed at 35 mph and its minimum central pressure at 1007 mb.
This image shows Tropical Storm Rosa in the Pacific Ocean at 1800 UTC on November 9, 2006. The storm's maximum sustained winds at the time were around 40 mph and the minimum central pressure was approximately 1002 mb.
Track map of Hurricane Bud of the 2006 Pacific hurricane season. The points show the location of the storm at 6-hour intervals. The colour represents the storm's maximum sustained wind speeds as classified in the (see below), and the shape of the data points represent the nature of the storm, according to the legend below.
Storm type
Track map of Hurricane Hector of the 2006 Pacific hurricane season. The points show the location of the storm at 6-hour intervals. The colour represents the storm's maximum sustained wind speeds as classified in the (see below), and the shape of the data points represent the nature of the storm, according to the legend below.
Storm type
This image of Tropical Depression 20E was captured by the MODIS instrument on NASA's Terra satellite at 1755 UTC on November 11, 2006 when it was located in the Pacific Ocean. At the time, maximum sustained winds were 35 mph and the minimum pressure was approximately 1005 mb.
Track map of Tropical Storm Norman of the 2006 Pacific hurricane season. The points show the location of the storm at 6-hour intervals. The colour represents the storm's maximum sustained wind speeds as classified in the (see below), and the shape of the data points represent the nature of the storm, according to the legend below.
Storm type
Track map of Tropical Storm Emilia of the 2006 Pacific hurricane season. The points show the location of the storm at 6-hour intervals. The colour represents the storm's maximum sustained wind speeds as classified in the (see below), and the shape of the data points represent the nature of the storm, according to the legend below.
Storm type
This map shows the tracks of all tropical cyclones in the 2006 Pacific hurricane season. The points show the location of each storm at 6-hour intervals. The colour represents the storm's maximum sustained wind speeds as classified in the Saffir-Simpson Hurricane Scale (see below), and the shape of the data points represent the type of the storm.
This image of Hurricane Lane was captured by the MODIS instrument on NASA's Aqua satellite at 2010 UTC on September 16, 2006. Lane had reached its peak sustained winds of 125 mph just a few hours before. Its estimated minimum pressure was also 952 mb.
Track map of Tropical Storm Rosa of the 2006 Pacific hurricane season. The points show the location of the storm at 6-hour intervals. The colour represents the storm's maximum sustained wind speeds as classified in the (see below), and the shape of the data points represent the nature of the storm, according to the legend below.
Storm type


