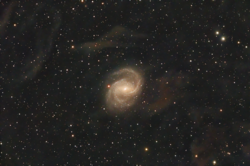
NGC 6951
| Galaxie NGC 6951 | |
|---|---|
(c) ESA/Hubble, CC BY 4.0 | |
| Aufnahme des Hubble-Weltraumteleskops | |
| AladinLite | |
| Sternbild | Kepheus |
| Position Äquinoktium: J2000.0, Epoche: J2000.0 | |
| Rektaszension | 20h 37m 14,41s [1] |
| Deklination | +66° 06′ 19,7″ [1] |
| Erscheinungsbild | |
| Morphologischer Typ | SAB(rs)bc / LINER / Sy2[1] |
| Helligkeit (visuell) | 11,0 mag[2] |
| Helligkeit (B-Band) | 11,8 mag[2] |
| Winkelausdehnung | 3,9′ × 3,2′[2] |
| Positionswinkel | 170°[2] |
| Inklination | 40° |
| Flächenhelligkeit | 13,6 mag/arcmin²[2] |
| Physikalische Daten | |
| Rotverschiebung | 0,004750 ± 0,000005[1] |
| Radialgeschwindigkeit | (1424 ± 1) km/s[1] |
| Hubbledistanz H0 = 73 km/(s • Mpc) | (73 ± 5) · 106 Lj (22,5 ± 1,6) Mpc [1] |
| Durchmesser | 85.000 Lj |
| Geschichte | |
| Entdeckung | Jérôme Eugène Coggia Lewis A. Swift |
| Entdeckungsdatum | 1877 14. September 1885 |
| Katalogbezeichnungen | |
| NGC 6951 / 6952 • UGC 11604 • PGC 65086 • CGCG 325-003 • MCG +11-25-002 • IRAS 20366+6555 • 2MASX J20371407+6606203 • 2XMM J203714.0+660619 | |
NGC 6951 = NGC 6952 ist eine Balken-Spiralgalaxie mit aktivem Galaxienkern vom Hubble-Typ SBbc im Sternbild Kepheus am Nordsternhimmel. Sie ist etwa 73 Millionen Lichtjahre von der Milchstraße entfernt und hat einen Durchmesser von ca. 70.000 Lichtjahren.
Die Galaxie NGC 6951 wurde am 14. September 1885 von dem US-amerikanischen Astronomen Lewis A. Swift entdeckt. Im Jahr 1877 beobachtete der französische Astronom Jérôme Eugène Coggia bereits dieselbe Galaxie. Die Doppelbeobachtung wurde nicht erkannt und so erhielt diese die Nummer NGC 6952.[3]
Am 26. Januar 2000 wurde in NGC 6951 die Supernova SN 2000E entdeckt.[4]
- Panoramaaufnahme
Literatur
- König, Michael & Binnewies, Stefan (2019): Bildatlas der Galaxien: Die Astrophysik hinter den Astrofotografien, Stuttgart: Kosmos, S. 176
Weblinks
Einzelnachweise
Auf dieser Seite verwendete Medien
Autor/Urheber: Juan lacruz, Lizenz: CC BY 4.0
NGC 6951
Es una galaxia Seyfert tipo II en la constelación Cepheus a una distancia de 75 millones de años luz. La galaxia se ve a través de una nebulosa de flujo integrado de nuestra galaxia.
https://en.wikipedia.org/wiki/Integrated_Flux_Nebula(c) ESA/Hubble, CC BY 4.0
The glittering galaxy in this NASA/ESA Hubble Space Telescope Picture of the Week is NGC 6951, which resides about 70 million light-years away in the constellation Cepheus.As this Hubble image shows, NGC 6951 is a spiral galaxy with plenty of intriguing structures. Most eye-catching are its spiral arms, which are dotted with brilliant red nebulae, bright blue stars and filamentary dust clouds. The spiral arms loop around the galactic centre, which has a golden glow that comes from a population of older stars. The centre of the galaxy is also distinctly elongated, revealing the presence of a slowly rotating bar of stars.NGC 6951’s bar may be responsible for another remarkable feature: a white-blue ring that encloses the very heart of the galaxy. This is called a circumnuclear starburst ring — essentially, a circle of enhanced star formation around the nucleus of a galaxy. The bar funnels gas toward the centre of the galaxy, where it collects in a ring about 3800 light-years across. Two dark dust lanes that run parallel to the bar mark the points where gas from the bar enters the ring.The dense gas of a circumnuclear starburst ring is the perfect environment to churn out an impressive number of stars. Using data from Hubble, astronomers have identified more than 80 potential star clusters within NGC 6951’s ring. Many of the stars formed less than 100 million years ago, but the ring itself is longer-lived, potentially having existed for 1–1.5 billion years.Astronomers have imaged NGC 6951 with Hubble for a wide variety of reasons, including mapping the dust in nearby galaxies, studying the centres of disc galaxies and keeping tabs on recent supernovae (of which NGC 6951 has hosted five or six).[Image Description: A spiral galaxy with large, open arms. A bar of yellow light, where old stars are gathered, crosses the middle of the disk. The very centre is a white point surrounded by a small, shining ring of star clusters. Thin lanes of dust swirl around this ring, reaching out to follow the spiral arms; also visible across the arms are red, glowing spots where stars are forming. To the right a star shines large and bright.]


