Matplotlib
| Matplotlib | |
|---|---|
 Eine Zusammenstellung aus fertigen Graphen und dem dazugehörigen Programmcode. | |
| Basisdaten | |
| Entwickler | John D. Hunter |
| Erscheinungsjahr | 2003[1] |
| Aktuelle Version | 3.10.1[2] (28. Februar 2025) |
| Betriebssystem | plattformunabhängig |
| Programmiersprache | Python |
| Kategorie | Programmbibliothek |
| Lizenz | Matplotlib-Lizenz |
| matplotlib.org | |
Matplotlib ist eine Programmbibliothek für die Programmiersprache Python, die es erlaubt, mathematische Darstellungen aller Art anzufertigen.
Beschreibung
Matplotlib kann mit Python 2.x (bis Matplotlib 2.2.x) und 3.x verwendet werden und funktioniert auf allen gängigen Betriebssystemen. Dabei wird eine Python-ähnliche objektorientierte Schnittstelle verwendet. Nach dem Importieren der Bibliothek kann man graphische Darstellungen mithilfe der Python-Konsole erzeugen. Man kann jedoch auch Matplotlib in bestehende Python-Programme integrieren. Dazu verwendet Matplotlib Anbindungen zu GUI-Bibliotheken wie GTK+, Qt, wxWidgets und Tk. Die Grafiken können in einer Vielzahl von Formaten erstellt werden, z. B.: SVG, PNG, Anti-Grain Geometry, EPS, PDF.
Entwicklung
Die erste Version von Matplotlib wurde von John D. Hunter in den Jahren 2002 und 2003 entwickelt.[3] Gleich zu Beginn war es als freie Open-Source-Bibliothek gedacht. Heute wird die Entwicklung auf GitHub von vielen Personen vorangetrieben.[4]
Beispiele
Kurven

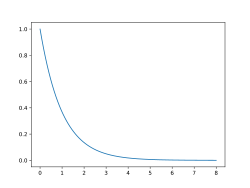
>>> import matplotlib.pyplot as plt
>>> import numpy as np
>>> a = np.linspace(0, 8, 501)
>>> b = np.exp(-a)
>>> plt.plot(a, b)
>>> plt.show()
Histogramm

>>> import matplotlib.pyplot as plt
>>> from numpy.random import normal,rand
>>> x = normal(size=200)
>>> plt.hist(x, bins=30, edgecolor='black')
>>> plt.show()
Streudiagramm

>>> import matplotlib.pyplot as plt
>>> from numpy.random import rand
>>> a = rand(100)
>>> b = rand(100)
>>> plt.scatter(a, b, edgecolor='black')
>>> plt.show()
3D-Plot

>>> from matplotlib import cm
>>> from mpl_toolkits.mplot3d import Axes3D
>>> import matplotlib.pyplot as plt
>>> import numpy as np
>>> fig = plt.figure()
>>> ax = fig.add_subplot(projection='3d')
>>> X = np.arange(-5, 5, 0.25)
>>> Y = np.arange(-5, 5, 0.25)
>>> X, Y = np.meshgrid(X, Y)
>>> R = np.sqrt(X**2 + Y**2)
>>> Z = np.sin(R)
>>> surf = ax.plot_surface(X, Y, Z, rstride=1, cstride=1, cmap=cm.coolwarm, edgecolor='black')
>>> plt.show()
Weitere Beispiele
Weblinks
- Offizielle Website
- Github-Seite von Matplotlib
- Matplotlib: Lessons from middle age – Video, in dem John D. Hunter die Entwicklung des Projekts beschreibt
- Matplotlib-Anleitung „SciPy Cookbook“ (englisch)
Einzelnachweise
- ↑ matplotlib.org.
- ↑ REL: v3.10.1. 28. Februar 2025 (abgerufen am 19. März 2025).
- ↑ John D. Hunter: Matplotlib: A 2D Graphics Environment. In: Computing in Science & Engineering. 9. Jahrgang, Nr. 3, S. 90–95, doi:10.1109/MCSE.2007.55.
- ↑ Matplotlib Credits. In: Matplotlib. Matplotlib, abgerufen am 7. August 2014.
Auf dieser Seite verwendete Medien
Autor/Urheber:
- Weight Growth of RN First Rate Line-of-Battle Ships 1630-1875.gif.gif by Toddy1
- SVG by Morn the Gorn
Weight growth of RN first rate line-of-battle ships 1630-1875
Autor/Urheber: Geek3, Lizenz: CC BY-SA 4.0
An example scatter plot of random points made with matplotlib version 3
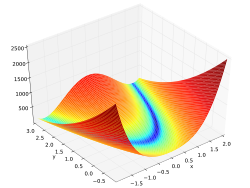
Rosenbrock function over . The Python code needs at least Matplotlib v0.99. The MATLAB/Octave code was tested with GNU Octave 4.2.2 and MATLAB R2016a.
Radiosondes data showing the Quasi-biennal oscillation of the stratospheric wind direction near the Equator.
Autor/Urheber: Geek3, Lizenz: CC BY-SA 4.0
An example line plot of an exponential function made with matplotlib version 3
Autor/Urheber: MagHoxpox, Lizenz: CC BY-SA 4.0
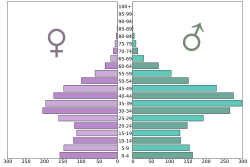
Population Pyramid of Kuwait in 2017.
Population in thousand.
Data from the United Nations, DESA/Population Division https://esa.un.org/unpd/wpp/DataQuery/
Created with Python and Matplotlib.Autor/Urheber: Geek3, Lizenz: CC BY-SA 4.0
An example histogram made with matplotlib version 3
Autor/Urheber: MagHoxpox, Lizenz: CC BY-SA 4.0
Amount of exports in millions of dollars per country in 2016, in logarithmic scale.
Data from from
http://data.worldbank.org/indicator/NE.EXP.GNFS.CD?year_high_desc=true
and
https://de.wikipedia.org/wiki/Liste_der_L%C3%A4nder_nach_Exporten
Country shapes from http://www.naturalearthdata.com/downloads/110m-cultural-vectors
Created with Python and Matplotlib Basemap Toolkit.Autor/Urheber: Morn, Lizenz: CC BY-SA 3.0
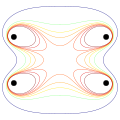
Cross section of B (magnetic field strength) magnitude in a Helmholtz coil (actually consisting of two coils: one at the top, one at the bottom in the plot). The eight contours are for field magnitudes of 0.5 B0, 0.8 B0, 0.9 B0, 0.95 B0, 0.99 B0, 1.01 B0, 1.05 B0, and 1.1 B0, where B0 is field strength at center. The large center area has almost uniform field strength.
Autor/Urheber: MTheiler, Lizenz: CC BY-SA 4.0
This plot shows a Stacked Bar Chart of the installed Wind power capacity in the Netherlands in MW. You find the Python code to regenerate this SVG below. Please update the data in the fututure ! Data from Wind_power_in_the_Netherlands
(c) Leland McInnes aus der englischsprachigen Wikipedia, CC BY-SA 3.0
Global average temperature, atmospheric CO2, and sunspot activity since 1850. Thick lines for temperature and sunspots represent a 25 year LOWESS and moving average smoothing of the raw data.
Autor/Urheber: Geek3, Lizenz: CC BY 3.0
A screenshot showing Matplotlib plots of one 3D plot_surface graph and a polar bar graph resembling the Matplotlib logo together with the graphic's python source code opened in a text editor.
Autor/Urheber: MTheiler, Lizenz: CC BY-SA 4.0
Windenergie in Finnland
Logarithmic spiral
Autor/Urheber: Geek3, Lizenz: CC BY-SA 4.0
An example 3D surface plot made with matplotlib version 3


