Brent (Öl)


Brent ist die für Europa wichtigste Rohölsorte und derzeit (2022) die Referenzsorte für den Weltmarkt. Die Preise von etwa 60 % der weltweit gehandelten Ölsorten werden ihren Eigenschaften entsprechend mit einem Auf- oder Abschlag zum Brent-Preis versehen. Gehandelt wird eigentlich Brent Blend, ursprünglich ein Mix, hauptsächlich aus den Feldern Brent und Ninian. Brent ist ein leichtes (viele niedrigsiedende und damit wertvollere Bestandteile) und „süßes“ (Schwefelgehalt 0,4 %) Rohöl mit einem API-Grad von 38. Je eher ein Rohöl siedet, desto besser eignet es sich für die Herstellung von Kraftstoffen.[1] Es stammt aus der Nordsee zwischen den Shetlandinseln und Norwegen. Von dort gelangt es über eine Unterwasser-Pipeline zum Ölterminal Sullom Voe auf Mainland, Shetland (ebenso wie das Öl vom Ninian-Feld) und wird per Tanker weiter transportiert. Bevor die Pipeline und das Ölterminal fertiggestellt waren, wurde das Öl in der Nordsee von Verladeinseln wie der Brent Spar auf Tanker verladen. Gehandelt wird es in London an der Warenterminbörse ICE Futures (früher „International Petroleum Exchange“).
Die beiden Ölfelder Brent und Ninian haben ihr Fördermaximum (Peak Oil) inzwischen überschritten. Daher setzt sich die Sorte heute aus dem Öl von vier Feldern (Brent, Forties, Oseberg und Ekofisk) zusammen, da das Brent-Ölfeld selbst nur noch etwa 170.000 Barrel pro Tag produziert[2], was bei einem weltweiten Verbrauch von (Stand: 2011) ca. 87 Mio. Barrel täglich nur etwa 0,2 % entspricht. Das Feld Brent grenzt im Osten an das norwegische Statfjord-Feld, zwischen beiden Feldern gibt es eine Übergabe-Pipeline.
Das Ölfeld Brent wird von den Firmen Shell UK Ltd. und Esso Exploration & Production UK Ltd. erschlossen, entdeckt wurde es im Jahr 1971, gefördert wird seit 1976, im Teilfeld „Brent South“ seit August 1992. Gefördert wurden beispielsweise im Jahr 1999 4.530.000 Tonnen, im Jahr 2000 3.533.000 Tonnen.
Die für Amerika wichtigste Ölsorte ist das in den USA geförderte West Texas Intermediate (WTI), das sich aufgrund seines niedrigen Schwefelgehaltes (ein qualitätsvolles WTI-Öl enthält etwa 0,24 % S) und einer API-Dichte von etwa 39,6 Grad besser als Brent raffinieren und zu Kraftstoff verarbeiten lässt.[1] In Asien beherrscht Dubai Fateh den Markt. Weitere Referenzölsorten sind Light Sour Blend (LSB), Leona, Tijuana, Alaska North Slope, Zuetina oder Urals.
Üblicherweise ist Brent aufgrund seiner Rolle als führende Referenzölsorte auf dem Weltmarkt immer etwas teurer als WTI, obwohl Letzteres für die Treibstoffherstellung besser taugt. Nur Ende Mai 2022 war WTI – auf hohem Niveau von etwa 115 $/Barrel, wegen der Folgen des Krieges Russlands gegen die Ukraine und einer angespannten Ölversorgungslage in den USA – kurzzeitig teurer als Brent.[1]
Weblinks
- Weltmarktpreis für Brent in Echtzeit
- Weltmarktpreise für Brent und WTI (mit ca. 20-minütiger Verzögerung) und Meldungen vom Öl-, Rohstoff- und Energiemarkt
Einzelnachweise
- ↑ a b c Why Investors Should Pay Close Attention To The Disappearing WTI-Brent Spread. Abgerufen am 30. Mai 2022 (englisch).
- ↑ North Sea Forties Weakens After Loadings Increase for February, Artikel auf bloomberg.com vom 10. Januar 2011
Auf dieser Seite verwendete Medien
Location of Brent oil platform in the North Sea
Autor/Urheber: TomTheHand, Lizenz: CC BY-SA 3.0
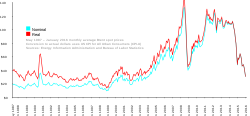
In the process of creating Image:Oil Prices 1861 2007.svg, I realized what an incredible wealth of information is available on the Energy Information Administration's web site. The 1861–2007 graph uses yearly averages, and I couldn't think of a really satisfying way to incorporate the price jumps of the past couple of months. Anyway, I think it's alright for a graph of 150 years of history to wait until the year's end to incorporate its data.
Instead, I've created this graph, which uses all available monthly average Brent spot prices from this EIA spreadsheet and the United States Consumer Price Index for All Urban Consumers (CPI-U), seasonally adjusted, from here (This is a direct link; but there may be a better one). The monthly numbers and limited date range give good detail, and coverage up to April 2008 shows the recent price jumps. It will be about a month before I can add May 2008, because it takes a little while for the Bureau of Labor Statistics to compile the CPI for the previous month..
I have no artistic talent whatsoever, so I know the color choices aren't great, but I have no eye for this stuff. I liked the blue and orange used by the 1861–2007 but I didn't want to use the same ones over again. I just chose a pair of RGB complementary colors. I am not married to this scheme; I'm happy to discuss alternatives. It's easy for me to make changes.
I will probably make more graphs from EIA data in the future. It's getting easier to work with SVG, though I know I still have a lot to learn.
