Australische Zyklonsaison 2022–2023
 Alle Stürme der Saison | |
| Bildung des ersten Sturms | 26. Juli 2022 |
|---|---|
| Auflösung des letzten Sturms | 2. Mai 2023 |
| Stärkster Sturm | Darian – 920 hPa (mbar), 120 kn (220 km/h) (10-minütig) |
| Tropische Tiefs | 25 |
| Tropische Zyklone | 7 |
| Schwere tropische Zyklone | 5 |
| Opferzahl gesamt | 8 |
| Gesamtschaden | mind. 2,7 Millionen US-Dollar |
| Australische Zyklonsaison 2020–21, 2021–22, 2022–2023, 2023–2024, 2024–2025 | |
Die Australische Zyklonsaison 2022–2023 ist eine Zyklonsaison in den Gewässern zwischen 90° und 160° östlicher Länge, die Australien umgeben. Die Saison begann zwar offiziell am 1. November 2022 und endet am 30. April 2023, doch können sich tropische Wirbelstürme in diesem Gebiet jederzeit bilden, sodass zu dieser Saison alle Systeme zählen, die sich zwischen dem 1. Juli 2022 und dem 30. Juni 2023 bilden.
Während der Saison werden tropische Zyklone offiziell überwacht durch das australische Bureau of Meteorology (BOM), die indonesische Meteorology, Climatology, and Geophysical Agency (BMKG) und den nationalen Wetterdienst von Papua-Neuguinea. Das Joint Typhoon Warning Center (JTWC) der Vereinigten Staaten gibt Warnungen heraus, die sich an amerikanische Einrichtungen und Schiffe in der Region richten.
Saisonverlauf
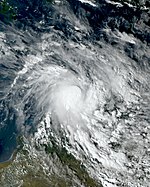
Die Saison begann ungewöhnlich früh am 26. Juli 2022 mit der Bildung eines tropischen Tiefs, das später als 01U ausgewiesen wurde.[1] Ein schwerer Zyklon der Saison war Zyklon Freddy, der außerhalb der australischen Region im März 2023 im Südosten Afrikas allein in Malawi zu über 1000 Todesopfern führte und weiteren in Mosambik und Madagaskar.[2] Im Februar traf Zyklon Gabrielle die Nordinsel Neuseelands und erreichte Böen mit Windgeschwindigkeiten von bis zu 160 km/h. Insgesamt kamen mindestens 11 Menschen ums Leben.[3][4] Am 5. April entstand Zyklon Ilsa, der am 13. April als Kategorie-5-Zyklon nördlich von Port Hedland auf die australische Küste traf. In der relativ unbewohnten Region kam es zu keinen Todesopfern. Auf der Australien vorgelagerten Insel Bedout Island wurde jedoch ein neuer Windrekord von 218 km/h über zehn Minuten gemessen.[5]
Stürme
Tropischer Kategorie-1-Zyklon 01U
| Tropischer Kategorie-1-Zyklon (BoM) | |||
|---|---|---|---|
| Tropischer Sturm | |||
| |||
| Dauer | 26. Juli – 31. Juli | ||
| Intensität | 45 kn (85 km/h) (10-minütig), 993 hPa | ||
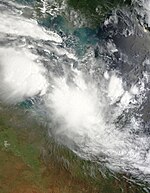
Das Bureau of Meteorology berichtete am 26. Juli 2022 die Bildung eines tropischen Tiefs nach zunehmender Monsunaktivität im Zuge einer Madden-Julian-Oszillation. Am 28. Juli um 15:00 UTC gab das JTWC einen Tropical Cyclone Formation Alert (TCFA) aus.[6] Das Tief bewegte sich weiter Richtung Südosten und am 29. Juli wurde kurz eine einem Zyklon entsprechende Intensität erreicht. Das Sturmsystem begann nach Südwesten abzudrehen und passierte westlich die Kokosinseln, wo es zu starken Niederschlägen, jedoch keinen bedeutenden Schäden kam. Am 31. Juli zog es weiter Richtung Westen.[1]
Tropisches Tief 02U
| Tropisches Tief (BoM) | |||
|---|---|---|---|
| Tropischer Sturm | |||
| |||
| Dauer | 1. November – 5. November (verließ Region) | ||
| Intensität | 35 kn (65 km/h) (1-minütig), 1004 hPa | ||
Ein beobachtetes tropisches Tief nahe 5,5 °S und 94 °O wurde am 2. November durch das Bureau of Meteorology mit geringem Zyklon-Entwicklungspotential bewertet. Eine Zugbahn zunächst Richtung Süden und anschließend Westen wurde vorhergesagt, mit einer geringen Wahrscheinlichkeit sich auf den Kokosinseln bemerkbar zu machen.[7] Das Tief erhielt am 3. November den Identifikationscode 02U und die Wahrscheinlichkeit sich zu einem Zyklon zu entwickeln, wurde nun mit einem etwas gestiegenen, moderaten Wert von 25 % angegeben.[8] Am 3. November um 03:00 UTC wurde durch das Joint Typhoon Warning Center ein Tropical Cyclone Formation Alert (TCFA) ausgegeben.[9]
Tropischer Kategorie-5-Zyklon Darian
| Tropischer Kategorie-5-Zyklon (BoM) | |||
|---|---|---|---|
| Kategorie-4-Zyklon | |||
| |||
| Dauer | 13. Dezember – 21. Dezember | ||
| Intensität | 120 kn (220 km/h) (10-minütig), 920 hPa | ||
Tropischer Kategorie-1-Zyklon Ellie
| Tropischer Kategorie-1-Zyklon (BoM) | |||
|---|---|---|---|
| Tropischer Sturm | |||
| |||
| Dauer | 21. Dezember – 8. Januar | ||
| Intensität | 40 kn (75 km/h) (10-minütig), 990 hPa | ||
Tropisches Tief Hale
| Tropisches Tief (BoM) | |||
|---|---|---|---|
| Tropischer Sturm | |||
| |||
| Dauer | 6. Januar – 7. Januar | ||
| Intensität | 40 kn (75 km/h) (10-minütig), 994 hPa | ||
Tropisches Tief 10U
| Tropisches Tief (BoM) | |||
|---|---|---|---|
| |||
| Dauer | 22. Januar – 26. Januar | ||
| Intensität | Windstärke unbekannt, 1001 hPa | ||
Tropisches Tief 11U / Dingani
| Tropisches Tief (BoM) | |||
|---|---|---|---|
| |||
| Dauer | 27. Januar – 9. Februar | ||
| Intensität | 30 kn (55 km/h) (10-minütig), 997 hPa | ||
Tropisches Tief 12U
| Tropisches Tief (BoM) | |||
|---|---|---|---|
| |||
| Dauer | 31. Januar – 4. Februar | ||
| Intensität | Windstärke unbekannt, 1002 hPa | ||
Tropischer Kategorie-4-Zyklon Freddy
| Tropischer Kategorie-4-Zyklon (BoM) | |||
|---|---|---|---|
| Kategorie-4-Zyklon | |||
| |||
| Dauer | 5. Februar – 14. Februar (verließ Region) | ||
| Intensität | 100 kn (185 km/h) (10-minütig), 941 hPa | ||
Am 30. Januar beobachtete das australische BOM die Bildung eines tropischen Tiefs über der Timorsee.[10] Am 21. Februar um 19:20 Uhr Lokalzeit traf der Zyklon, der den Namen Freddy erhielt, nach 15-tägiger Überquerung des Indischen Ozeans und Verlassen der australischen Region auf die Ostküste Madagaskars nördlich von Mananjary.[11]
Kategorie-3-Zyklon Gabrielle
| Kategorie-3-Zyklon (BoM) | |||
|---|---|---|---|
| Kategorie-2-Zyklon | |||
| |||
| Dauer | 5. Februar – 10. Februar (verließ Region) | ||
| Intensität | 80 kn (150 km/h) (10-minütig), 958 hPa | ||
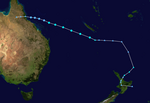
Am 6. Februar 2023 wurde südlich der Salomonen im Nordosten des Korallenmeers ein tropisches Tief ausgemacht, das die Bezeichnung 14U erhielt.[12] Später wurde es vom australischen BOM als Zyklon identifiziert und als Gabrielle benannt. Als Zyklon der Kategorie 3 wies es Böen bis zu 165 km/h Windgeschwindigkeit auf.[13]
Tropisches Tief 15U
| Tropisches Tief (BoM) | |||
|---|---|---|---|
| |||
| Dauer | 11. Februar – 17. Februar | ||
| Intensität | 25 kn (45 km/h) (10-minütig), 997 hPa | ||
Tropisches Tief 16U
| Tropisches Tief (BoM) | |||
|---|---|---|---|
| |||
| Dauer | 23. Februar – 10. März | ||
| Intensität | Windstärke unbekannt, 995 hPa | ||
Tropisches Tief 17U
| Tropisches Tief (BoM) | |||
|---|---|---|---|
| |||
| Dauer | 24. Februar – 27. Februar | ||
| Intensität | Windstärke unbekannt, 999 hPa | ||
Tropisches Tief 18U
| Tropisches Tief (BoM) | |||
|---|---|---|---|
| |||
| Dauer | 27. Februar – 1. März (verließ Region) | ||
| Intensität | 30 kn (55 km/h) (10-minütig), 998 hPa | ||
Tropisches Tief 20U
| Tropisches Tief (BoM) | |||
|---|---|---|---|
| |||
| Dauer | 25. März – 30. März | ||
| Intensität | Windstärke unbekannt, 1005 hPa | ||
Tropischer Kategorie-5-Zyklon Herman
| Tropischer Kategorie-5-Zyklon (BoM) | |||
|---|---|---|---|
| |||
| Dauer | 29. März – 5. April | ||
| Intensität | 110 kn (205 km/h) (10-minütig), 935 hPa | ||
Tropisches Tief 22U
| Tropisches Tief (BoM) | |||
|---|---|---|---|
| |||
| Dauer | 30. März – 2. April | ||
| Intensität | Windstärke unbekannt | ||
Tropischer Kategorie-5-Zyklon Ilsa
| Tropischer Kategorie-5-Zyklon (BoM) | |||
|---|---|---|---|
| Kategorie-5-Zyklon | |||
| |||
| Dauer | 5. April – 15. April | ||
| Intensität | 115 kn (215 km/h) (10-minütig), 928 hPa | ||
Am 30. März beobachtete das australische BOM die Bildung eines möglichen Tiefdruckgebiets für die erste Aprilwoche, das die Bezeichnung 23U erhielt. Das potentielle Risiko wurde als sehr niedrig eingestuft.[14] Am 5. April wurde die erwartete Bildung in der Arafurasee beobachtet und mit einer Zugbahn Richtung Südwesten in die Timorsee und einer zunehmenden Intensität gerechnet, die auch eintraf.[15] Am 7. April wurde schließlich ein Tropical Cyclone Formation Alert (TCFA) durch das JTWC ausgegeben[16] und das Sturmsystem am Folgetag als Tropical Cyclone 18S klassifiziert.[17] Am 11. April erhielt es die Klassifizierung als Zyklon der Kategorie 1 und den Namen Ilsa.[18] Der Zyklon nahm auf seiner Zugbahn Richtung Südwesten weiter an Intensität zu. Vor seinem Landfall erreichte der Zyklon auf der vorgelagerten Insel Bedout Island über zehn Minuten eine Windgeschwindigkeit von 218 km/h und damit einen neuen Rekordwert für Australien.[19][20] Am 13. April traf er schließlich etwa 120 km nordöstlich von Port Hedland in einer dünn besiedelten Region von Pilbara gegen 16:00 UTC auf die australische Küste mit einer der Kategorie 5 entsprechenden Intensität.[21] Die Spitzengeschwindigkeiten erreichten 288 km/h.[19] Wie in Satellitenaufnahmen erkennbar, war das Auge des Zyklons relativ klein (Pinhole Eye), was für Stürme mit hoher Intensität typisch ist.[22] Beim Zug Richtung Ost-Südosten über Western Australia schwächte sich der Zyklon ab[23] und erreichte schließlich am 15. April eine nicht mehr als Zyklon kategoriesierte Intensität.[24]
Weblinks
- Joint Typhoon Warning Center (englisch)
- Australian Bureau of Meteorology (englisch)
- Tropical Cyclone Warning Center Jakarta (indonesisch)
Einzelnachweise
- ↑ a b Unnamed Tropical Cyclone 01U. (PDF) August 2022, abgerufen am 16. April 2023 (englisch).
- ↑ Keliah Daniels: Malawi death toll now at 1 000 after Cyclone Freddy. The South African, 14. April 2023, abgerufen am 16. Januar 2023 (englisch).
- ↑ Tropensturm "Gabrielle" Zehntausende Haushalte in Neuseeland ohne Strom. Tagesschau, abgerufen am 16. April 2023.
- ↑ Mindestens elf Tote nach Zyklon „Gabrielle“ in Neuseeland. weser-kurier.de, abgerufen am 16. April 2023.
- ↑ Tom Housden, Tiffany Wertheimer: Cyclone Ilsa: Powerful storm hits Western Australia. BBC News, 14. April 2023, abgerufen am 16. April 2023 (englisch).
- ↑ WTXS21 PGTW 281500. Archiviert vom am 28. Juli 2022; abgerufen am 17. April 2023 (englisch).
- ↑ Tropical Cyclone Outlook for the Western Region (Memento vom 2. November 2022 im Internet Archive), Bureau of Meteorology, 2. November 2022
- ↑ Tropical Cyclone Outlook for the Western Region (Memento vom 3. November 2022 im Internet Archive), Bureau of Meteorology, 3. November 2022
- ↑ WTXS21 PGTW 030600 (Memento vom 3. November 2022 im Internet Archive), metoc.navy.mil, 3. November 2023
- ↑ Tropical Cyclone Outlook for the Western Region. In: paladinofstorms.net. Archiviert vom am 27. März 2023; abgerufen am 16. April 2023 (englisch).
- ↑ Cyclone Freddy Hits Madagascar. In: Nasa Earth Observatory. 22. Februar 2023, abgerufen am 16. April 2023 (englisch).
- ↑ Updated Tropical Cyclone Outlook for Coral Sea (6. April 2023) (Memento vom 11. Februar 2023 im Internet Archive)
- ↑ Datenblatt. zoom.earth, abgerufen am 17. April 2023.
- ↑ Tropical Cyclone Outlook for the Northern Region, including the Gulf of Carpentaria. In: paladinofstorms.net. 30. März 2023, archiviert vom am 4. April 2023; abgerufen am 16. April 2023 (englisch).
- ↑ Tropical Cyclone Outlook for the Northern Region, including the Gulf of Carpentaria. In: paladinofstorms.net. 5. April 2023, archiviert vom am 7. April 2023; abgerufen am 16. April 2023 (englisch).
- ↑ WTXS21 PGTW 072000. In: wis-jma.go.jp. Archiviert vom am 7. April 2023; abgerufen am 16. April 2023 (englisch).
- ↑ WDXS31 PGTW 082100. In: wiki.chlod.net. Abgerufen am 16. April 2023 (englisch).
- ↑ AXAU01 APRF 020637. In: tropicalcyclonedata.net. Abgerufen am 14. April 2023 (englisch).
- ↑ a b Australien meldet Zyklon mit Windrekord. Die Zeit, 14. April 2023, abgerufen am 16. April 2023.
- ↑ Tom Housden & Tiffany Wertheimer: Cyclone Ilsa: Powerful storm hits Western Australia. BBC News, 14. April 2023, abgerufen am 14. April 2023 (englisch).
- ↑ AXAU01 APRF 131906. In: tropicalcyclonedata.net. Abgerufen am 16. April 2023 (englisch).
- ↑ Cyclone Ilsa Reaches Western Australia. NASA Earth Observatory, 13. April 2023, abgerufen am 16. April 2023 (englisch).
- ↑ AXAU01 APRF 131906. In: tropicalcyclonedata.net. 13. April 2023, abgerufen am 16. April 2023 (englisch).
- ↑ Tropical Cyclone Ilsa: recovery starts in Western Australia as cyclone weakens further. ash.org, 16. April 2023, abgerufen am 16. April 2023 (englisch).
Auf dieser Seite verwendete Medien
Tropical Low 20U on 24 March 2023.
Track map of Tropical Low 16U of the 2022-23 Australian region cyclone season. The points show the location of the storm at 6-hour intervals. The colour represents the storm's maximum sustained wind speeds as classified in the (see below), and the shape of the data points represent the nature of the storm, according to the legend below.
Storm type
Track map of Tropical Low 20U of the 2022-23 Australian region cyclone season. The points show the location of the storm at 6-hour intervals. The colour represents the storm's maximum sustained wind speeds as classified in the (see below), and the shape of the data points represent the nature of the storm, according to the legend below.
Storm type
A tilted view of Tropical Low 11U over the open Indian Ocean on 7 February 2023.
This map shows the tracks of all tropical cyclones in the 2022-23 Australian region cyclone season. The points show the location of each storm at 6-hour intervals. The colour represents the storm's maximum sustained wind speeds as classified in the Saffir-Simpson Hurricane Scale (see below), and the shape of the data points represent the type of the storm. Map generation parameters: --res 4000 --extra 1 --dots 0.2 --lines 0.04 --xmax 160 --xmin 90 --ymax 0 --ymin -50
Place-holder image for use in Southern Hemisphere tropical cyclone articles, without an image or track map.
Severe Tropical Cyclone Herman on the afternoon of 31 March 2023.
(c) Japan Meteorological Agency, CC BY 4.0
Severe Tropical Cyclone Gabrielle shortly before crossing the 160th meridian east on 10 February 2023.
Track map of Tropical Low 12U of the 2022-23 Australian region cyclone season. The points show the location of the storm at 6-hour intervals. The colour represents the storm's maximum sustained wind speeds as classified in the (see below), and the shape of the data points represent the nature of the storm, according to the legend below.
Storm type
Tropical Low 15U on 15 February 2023.
Severe Tropical Cyclone Ilsa on the afternoon of 13 April 2023.
Track map of Severe Tropical Cyclone Ilsa of the 2022-23 Australian region cyclone season. The points show the location of the storm at 6-hour intervals. The colour represents the storm's maximum sustained wind speeds as classified in the (see below), and the shape of the data points represent the nature of the storm, according to the legend below.
Storm type
Track map of Severe Tropical Cyclone Freddy / Very Intense Tropical Cyclone Freddy of the 2022-23 Australian region cyclone season and the 2022-23 South-West Indian Ocean cyclone season. The points show the location of the storm at 6-hour intervals. The colour represents the storm's maximum sustained wind speeds as classified in the (see below), and the shape of the data points represent the nature of the storm, according to the legend below.
Storm type
(c) Japan Meteorological Agency, CC BY 4.0
Tropical Cyclone Ellie on the evening of 22 December 2022.
Track map of Tropical Cyclone Hale of the 2022-23 Australian region cyclone season and the 2022-23 South Pacific cyclone season. The points show the location of the storm at 6-hour intervals. The colour represents the storm's maximum sustained wind speeds as classified in the (see below), and the shape of the data points represent the nature of the storm, according to the legend below.
Storm type
Track map of Severe Tropical Cyclone Gabrielle of the 2022-23 Australian region cyclone season and the 2022-23 South Pacific cyclone season. The points show the location of the storm at 6-hour intervals. The colour represents the storm's maximum sustained wind speeds as classified in the (see below), and the shape of the data points represent the nature of the storm, according to the legend below.
Storm type
Tropical Low 12U on 4 February 2023.
Severe Tropical Cyclone Freddy on the afternoon of 12 February 2023.
Track map of Tropical Low 18U / Severe Tropical Cyclone Kevin of the 2022-23 Australian region cyclone season and the 2022-23 South Pacific cyclone season. The points show the location of the storm at 6-hour intervals. The colour represents the storm's maximum sustained wind speeds as classified in the (see below), and the shape of the data points represent the nature of the storm, according to the legend below.
Storm type
Tropical Cyclone 01U on 29 July 2022.
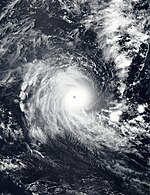
Severe Tropical Cyclone Darian shortly before leaving the Australian basin on the afternoon of 21 December 2022.
Track map of Tropical Low 10U of the 2022-23 Australian region cyclone season. The points show the location of the storm at 6-hour intervals. The colour represents the storm's maximum sustained wind speeds as classified in the (see below), and the shape of the data points represent the nature of the storm, according to the legend below.
Storm type
Track map of Tropical Low 15U of the 2022-23 Australian region cyclone season. The points show the location of the storm at 6-hour intervals. The colour represents the storm's maximum sustained wind speeds as classified in the (see below), and the shape of the data points represent the nature of the storm, according to the legend below.
Storm type
Track map of Tropical Cyclone Ellie of the 2022-23 Australian region cyclone season. The points show the location of the storm at 6-hour intervals. The colour represents the storm's maximum sustained wind speeds as classified in the (see below), and the shape of the data points represent the nature of the storm, according to the legend below.
Storm type
Track map of Tropical Cyclone 01U of the 2022-23 Australian region cyclone season. The points show the location of the storm at 6-hour intervals. The colour represents the storm's maximum sustained wind speeds as classified in the (see below), and the shape of the data points represent the nature of the storm, according to the legend below.
Storm type
Tropical Low 10U on 23 January 2023.
Tropical Low 16U on 6 March 2023.
(c) Japan Meteorological Agency, CC BY 4.0
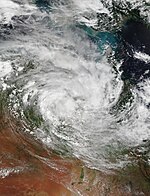
Tropical Low 07U intensifying while moving away from Queensland on the evening of 7 January 2023.
Tropical Low 18U on 1 March 2023.
Track map of Tropical Low 02U / Tropical Depression 03 of the 2022-23 Australian region cyclone season and the 2022-23 South-West Indian Ocean cyclone season. The points show the location of the storm at 6-hour intervals. The colour represents the storm's maximum sustained wind speeds as classified in the (see below), and the shape of the data points represent the nature of the storm, according to the legend below.
Storm type
Track map of Tropical Low 11U / Tropical Cyclone Dingani of the 2022-23 Australian region cyclone season and the 2022-23 South-West Indian Ocean cyclone season. The points show the location of the storm at 6-hour intervals. The colour represents the storm's maximum sustained wind speeds as classified in the (see below), and the shape of the data points represent the nature of the storm, according to the legend below.
Storm type
Track map of Severe Tropical Cyclone Herman of the 2022-23 Australian region cyclone season. The points show the location of the storm at 6-hour intervals. The colour represents the storm's maximum sustained wind speeds as classified in the (see below), and the shape of the data points represent the nature of the storm, according to the legend below.
Storm type
Track map of Severe Tropical Cyclone Darian / Very Intense Tropical Cyclone Darian of the 2022-23 Australian region cyclone season and the 2022-23 South-West Indian Ocean cyclone season. The points show the location of the storm at 6-hour intervals. The colour represents the storm's maximum sustained wind speeds as classified in the (see below), and the shape of the data points represent the nature of the storm, according to the legend below.
Storm type
Tropical Low 02U on 3 November 2022


