Atlantische Hurrikansaison 2015
 Alle Stürme der Saison | |
| Bildung des ersten Sturms | 8. Mai 2015 |
|---|---|
| Auflösung des letzten Sturms | 11. November 2015 |
| Stärkster Sturm | Hurrikan Joaquin – 931 hPa (mbar), 155 kn (287 km/h) |
| Tropische Tiefs | 12 |
| Stürme | 11 |
| Hurrikane | 4 |
| Schwere Hurrikane (Kat. 3+) | 2 |
| Opferzahl gesamt | 83 |
| Gesamtschaden | ≥ 730,4 Millionen $ (2015) |
| Atlantische Hurrikansaison 2013, 2014, 2015, 2016, 2017 | |
Die Atlantische Hurrikansaison 2015 begann offiziell am 1. Juni und endete am 30. November.[1] Während dieser Periode bilden sich üblicherweise die meisten Hurrikane, da nur zu dieser Zeit geeignete Bedingungen existieren, wie etwa ein warmer Ozean, feuchte Luft und wenig Windscherung, um die Bildung von tropischen Wirbelstürmen zu ermöglichen. Die Saison begann ein Monat vor dem offiziellen Start mit dem Tropischen Sturm Ana.
Stürme im Pazifischen Ozean sind im Artikel Pazifische Hurrikansaison 2015 gelistet.
Übersicht
Im Jahr 2015 der Atlantischen Hurrikansaison entwickelten sich im atlantischen Becken 12 tropische Tiefdruckgebiete, von denen 11 die Stärke eines tropischen Sturms erreichten. Von diesen erreichten vier Hurrikanstärke. Hurrikan Joaquin war der stärkste Sturm der Saison und erreichte andauernde Windgeschwindigkeiten von bis zu 250 km/h.
Stürme
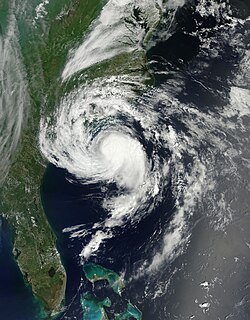
Tropischer Sturm Ana
| Tropischer Sturm | |||
|---|---|---|---|
| |||
| Dauer | 8. Mai – 11. Mai | ||
| Intensität | 50 kn (95 km/h) (1-minütig), 998 hPa | ||
Tropischer Sturm Bill
| Tropischer Sturm | |||
|---|---|---|---|
| |||
| Dauer | 16. Juni – 18. Juni | ||
| Intensität | 50 kn (95 km/h) (1-minütig), 997 hPa | ||
Tropischer Sturm Claudette
| Tropischer Sturm | |||
|---|---|---|---|
| |||
| Dauer | 13. Juli – 14. Juli | ||
| Intensität | 45 kn (85 km/h) (1-minütig), 1003 hPa | ||
Hurrikan Danny
| Kategorie-3-Hurrikan | |||
|---|---|---|---|
| |||
| Dauer | 18. August – 24. August | ||
| Intensität | 100 kn (185 km/h) (1-minütig), 960 hPa | ||
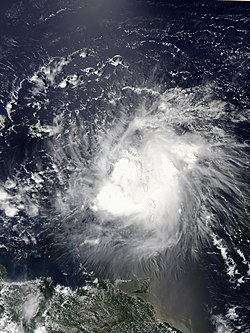
Tropischer Sturm Erika
| Tropischer Sturm | |||
|---|---|---|---|
| |||
| Dauer | 24. August – 28. August | ||
| Intensität | 45 kn (85 km/h) (1-minütig), 1001 hPa | ||
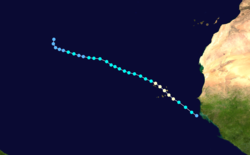
Hurrikan Fred
| Kategorie-1-Hurrikan | |||
|---|---|---|---|
| |||
| Dauer | 30. August – 6. September | ||
| Intensität | 75 kn (140 km/h) (1-minütig), 986 hPa | ||
Tropischer Sturm Grace
| Tropischer Sturm | |||
|---|---|---|---|
| |||
| Dauer | 5. September – 9. September | ||
| Intensität | 45 kn (85 km/h) (1-minütig), 1000 hPa | ||
Tropischer Sturm Henri
| Tropischer Sturm | |||
|---|---|---|---|
| |||
| Dauer | 8. September – 11. September | ||
| Intensität | 45 kn (85 km/h) (1-minütig), 1003 hPa | ||
Tropisches Tief Neun
| Tropisches Tiefdruckgebiet | |||
|---|---|---|---|
| |||
| Dauer | 16. September – 19. September | ||
| Intensität | 30 kn (55 km/h) (1-minütig), 100+ hPa | ||
Tropischer Sturm Ida
| Tropischer Sturm | |||
|---|---|---|---|
| |||
| Dauer | 18. September – 27. September | ||
| Intensität | 45 kn (85 km/h) (1-minütig), 1001 hPa | ||
Hurrikan Joaquin
| Kategorie-4-Hurrikan | |||
|---|---|---|---|
| |||
| Dauer | 28. September – 8. Oktober | ||
| Intensität | 135 kn (250 km/h) (1-minütig), 931 hPa | ||
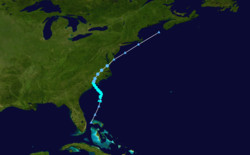
Hurrikan Kate
| Kategorie-1-Hurrikan | |||
|---|---|---|---|
| |||
| Dauer | 8. November – 11. November | ||
| Intensität | 65 kn (120 km/h) (1-minütig), 980 hPa | ||
Saisonverlauf
Sturmnamen
Die folgenden Namen wurden in dieser Saison vergeben. Diese Liste ist identisch mit der Liste für die Atlantische Hurrikansaison 2009. Durch die World Meteorological Organization wurden im April 2016 die Namen Erika und Joaquin von der Liste der Namen tropischer Wirbelstürme gestrichen, weil diese Stürme erheblichen Schaden anrichteten und zu wesentlichen Personenschäden führten. Diese Namen wurden durch Elsa und Julian ersetzt. Die nicht gestrichenen Namen wurden für die Atlantische Hurrikansaison 2021 erneut verwendet.[2]
|
|
|
|
|
|
Siehe auch
Weblinks
- National Hurricane Center
- Tropical Weather Outlook des National Hurricane Center für den Atlantik
- Graphical Tropical Weather Outlook des National Hurricane Center für den Atlantik
Einzelnachweise
- ↑ Tropical Cyclone Climatology. National Hurrican Center, abgerufen am 5. November 2016 (englisch).
- ↑ World Meteorological Organization retires storm names Erika, Joaquin and Patricia. National Oceanic and Atmospheric Administration, 25. April 2016, abgerufen am 12. September 2017 (englisch).
Auf dieser Seite verwendete Medien
Track map of Hurricane Kate of the 2015 Atlantic hurricane season. The points show the location of the storm at 6-hour intervals. The colour represents the storm's maximum sustained wind speeds as classified in the (see below), and the shape of the data points represent the nature of the storm, according to the legend below.
Storm type
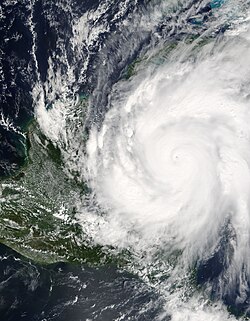
Hurricane Wilma was a powerful Category 5 storm when the Moderate Resolution Imaging Spectroradiometer (MODIS) on NASA’s Terra satellite took this image at 12:40 p.m. Eastern Daylight Time, on October 19, 2005. Less than 24 hours before this image was taken, Wilma had rapidly grown into a record-breaking, powerful storm. Winds around the eyewall of the storm were raging at 280 kilometers per hour (175 miles per hour). Just hours before, National Oceanographic and Atmospheric Administration (NOAA) aircraft measured a record-low air pressure of 882 millibars in the center of Hurricane Wilma, making it the most intense hurricane ever observed in the Atlantic basin. Wilma also broke records for the fastest development of a storm, going from tropical storm status to Category 5 hurricane in less than 24 hours.
The high-resolution image provided above has a spatial resolution of 250 meters per pixel. The MODIS Rapid Response Team provides this image at additional resolutions.Tropical Storm Grace near peak strength on September 6, 2015
Hurricane Danny on August 21, 2015
Tropical Storm Erika (05L) over the Lesser Antilles (afternoon overpass)
Track map of Tropical Depression Nine of the 2015 Atlantic hurricane season. The points show the location of the storm at 6-hour intervals. The colour represents the storm's maximum sustained wind speeds as classified in the (see below), and the shape of the data points represent the nature of the storm, according to the legend below.
Storm type
Tropical Depression Nine (09L) over in the Atlantic on September 16, 2015
Track map of Tropical Storm Grace of the 2015 Atlantic hurricane season. The points show the location of the storm at 6-hour intervals. The colour represents the storm's maximum sustained wind speeds as classified in the (see below), and the shape of the data points represent the nature of the storm, according to the legend below.
Storm type
Track map of Tropical Storm Ana of the 2015 Atlantic hurricane season. The points show the location of the storm at 6-hour intervals. The colour represents the storm's maximum sustained wind speeds as classified in the (see below), and the shape of the data points represent the nature of the storm, according to the legend below.
Storm type
Track map of Tropical Storm Erika of the 2015 Atlantic hurricane season. The points show the location of the storm at 6-hour intervals. The colour represents the storm's maximum sustained wind speeds as classified in the (see below), and the shape of the data points represent the nature of the storm, according to the legend below.
Storm type
Tropical Storm Bill, the second named tropical cyclone of the 2015 Atlantic hurricane season, making landfall on the Central Texas Gulf Coast on June 16, 2015.
Track map of Tropical Storm Henri of the 2015 Atlantic hurricane season. The points show the location of the storm at 6-hour intervals. The colour represents the storm's maximum sustained wind speeds as classified in the (see below), and the shape of the data points represent the nature of the storm, according to the legend below.
Storm type
Track map of Hurricane Fred of the 2015 Atlantic hurricane season. The points show the location of the storm at 6-hour intervals. The colour represents the storm's maximum sustained wind speeds as classified in the (see below), and the shape of the data points represent the nature of the storm, according to the legend below.
Storm type
Satellite image of Tropical Storm Claudette on July 13, 2015 as imaged by the Suomi NPP satellite.
Hurricane Fred (06L) over the Cape Verde Islands on August 31, 2015
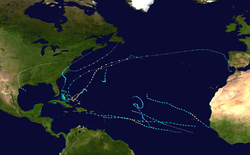
This map shows the tracks of all tropical cyclones in the 2015 Atlantic hurricane season. The points show the location of each storm at 6-hour intervals. The colour represents the storm's maximum sustained wind speeds as classified in the Saffir-Simpson Hurricane Scale (see below), and the shape of the data points represent the type of the storm.
Tropical Storm Ana on May 9, 2015
Track map of Hurricane Joaquin of the 2015 Atlantic hurricane season. The points show the location of the storm at 6-hour intervals. The colour represents the storm's maximum sustained wind speeds as classified in the (see below), and the shape of the data points represent the nature of the storm, according to the legend below.
Storm type
Track map of Tropical Storm Claudette of the 2015 Atlantic hurricane season. The points show the location of the storm at 6-hour intervals. The colour represents the storm's maximum sustained wind speeds as classified in the (see below), and the shape of the data points represent the nature of the storm, according to the legend below.
Storm type
Tropical Storm Ida (10L) in the central Atlantic
Track map of Hurricane Danny of the 2015 Atlantic hurricane season. The points show the location of the storm at 6-hour intervals. The colour represents the storm's maximum sustained wind speeds as classified in the (see below), and the shape of the data points represent the nature of the storm, according to the legend below.
Storm type
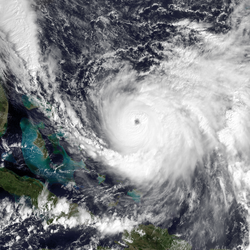
Visible satellite imagery of Hurricane Joaquin at the time of its peak winds on October 3, 2015.
Track map of Tropical Storm Ida of the 2015 Atlantic hurricane season. The points show the location of the storm at 6-hour intervals. The colour represents the storm's maximum sustained wind speeds as classified in the (see below), and the shape of the data points represent the nature of the storm, according to the legend below.
Storm type
Tropical Storm Henri meandering over the North Atlantic near Bermuda on September 10, 2015
Track map of Tropical Storm Bill of the 2015 Atlantic hurricane season. The points show the location of the storm at 6-hour intervals. The colour represents the storm's maximum sustained wind speeds as classified in the (see below), and the shape of the data points represent the nature of the storm, according to the legend below.
Storm type
Hurricane Kate (12L) in the North Atlantic Ocean
