Atlantische Hurrikansaison 2006
 Alle Stürme der Saison | |
| Bildung des ersten Sturms | 10. Juni 2006 |
|---|---|
| Auflösung des letzten Sturms | 2. Oktober 2006 |
| Stärkster Sturm | Helene & Gordon – 955 hPa (mbar), 105 kn (195 km/h) |
| Stürme | 10 |
| Hurrikane | 5 |
| Schwere Hurrikane (Kat. 3+) | 2 |
| Opferzahl gesamt | 7 direkt, 7 indirekt |
| Gesamtschaden | 500 Millionen $ (2006) |
| Atlantische Hurrikansaison 2004, 2005, 2006, 2007, 2008 | |
Die Atlantische Hurrikansaison 2006 begann offiziell am 1. Juni und endete am 30. November. Innerhalb dieser Periode bilden sich die meisten Tropischen Stürme, da nur zu dieser Zeit geeignete Bedingungen, wie etwa ein warmer Ozean, feuchte Luft und wenig Windscherung, existieren, um die Bildung von Tropischen Wirbelstürmen zu ermöglichen.
Während der atlantischen Hurrikansaison 2006 gab es deutlich weniger Wirbelstürme, als zunächst am Beginn des Jahres prognostiziert wurde.[1] Es gab keinen Hurrikan der Stärke 4 oder 5, insgesamt fünf Stürme, welche die Stärke eines Hurrikans erreichten, davon zwei Starke, und drei Stürme erreichten das Festland. Die höchste am Festland gemessene Windgeschwindigkeit betrug 72 km/h (Alberto bei Panhandle nahe Adams Beach am 13. Juni). Im Oktober und November 2006 bildete sich kein Wirbelsturm mehr. Damit war es eine Durchschnittssaison (1950–2000 Durchschnitt: insgesamt 9,6 Stürme, davon 5,9 Hurrikane und 2,3 starke Hurrikane).[1]
Stürme
Tropischer Sturm Alberto
| Tropischer Sturm | |||
|---|---|---|---|
| |||
| Dauer | 10. Juni – 14. Juni | ||
| Intensität | 60 kn (110 km/h) (1-minütig), 995 hPa | ||
Am 10. Juni organisierte sich vor der Küste von Belize das erste Tropische Tiefdruckgebiet der Saison. Trotz vertikaler Windscherung verstärkte sich das Tiefdruckgebiet am Morgen des 11. Juni zum Tropischen Sturm Alberto. Der am Anfang eher unorganisierte und schwache tropische Sturm konnte sich dann aber schließlich auf dem Loop Current, einer warmen Strömung im Golf von Mexiko, zu einem starken tropischen Sturm mit Windgeschwindigkeiten von bis zu 115 km/h, also knapp unter Hurrikanstärke, intensivieren. Über den seichteren Gewässern vor der Küste Floridas schwächte er sich jedoch ab und ging am 13. Juni, 85 km südöstlich von Tallahassee an Land, wo er leichtere Schäden und Überflutungen verursachte. Am 14. Juni verlor der nunmehr zu einem tropischen Tief herabgestufte Alberto alle seine tropische Merkmale und wurde damit extratropisch.
Unbenannter Tropischer Sturm
| Tropischer Sturm | |||
|---|---|---|---|
| |||
| Dauer | 17. Juli – 18. Juli | ||
| Intensität | 45 kn (85 km/h) (1-minütig), 998 hPa | ||
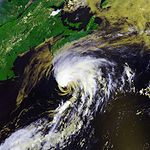
In der Nachanalyse wurde ein zunächst unerkannter tropischer Sturm entdeckt, der sich am 17. Juli am Golfstrom, südlich von Nantucket, aus einem extratropischen Tief entwickelte. Das System war kurz ein tropischer Sturm, bevor es sich am 18. Juli, südöstlich von Nova Scotia, in ein Resttief degenerierte. Es brachte Wind und Regen über Teile des atlantischen Kanadas, ohne Schäden zu verursachen.
Tropischer Sturm Beryl
| Tropischer Sturm | |||
|---|---|---|---|
| |||
| Dauer | 18. Juli – 21. Juli | ||
| Intensität | 50 kn (95 km/h) (1-minütig), 1000 hPa | ||
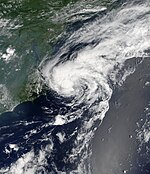
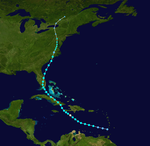
Mitte Juli zog eine Kaltfront in Richtung Ostküste der USA und löste sich auf, wobei sich zwei Tiefdruckgebiete bildeten. Das nördlichere der beiden konnte sich schnell organisieren und wurde zunächst, bis zur Nachanalyse, nicht als tropischer Sturm anerkannt, das südlichere der beiden bewegte sich kaum und blieb vor der Küste North Carolinas, ohne wirklich organisiert zu sein. Am 18. Juli jedoch fing es an sich schnell zu organisieren und wurde danach zum zweiten tropischen Tiefdruckgebiet der Saison aufgestuft. Das Tief bewegte sich langsam nach Norden und verstärkte sich am warmen Golfstrom zum tropischen Sturm Beryl. Beryl ging dann am 21. Juli bei Nantucket, Massachusetts an Land, wo sie nur leichte Schäden anrichtete.
Tropischer Sturm Chris
| Tropischer Sturm | |||
|---|---|---|---|
| |||
| Dauer | 31. Juli – 5. August | ||
| Intensität | 55 kn (100 km/h) (1-minütig), 1001 hPa | ||
Ende Juli formte sich vor der Küste Afrikas eine kräftige tropische Welle und driftete langsam westwärts. Sie konnte sich aufgrund von trockener Luft aber nur äußerst langsam entwickeln. Trotzdem konnte sie sich am 31. Juli genug organisieren, um zu einem tropischen Tiefdruckgebiet aufgestuft zu werden. Das Tiefdruckgebiet verstärkte sich am 1. August zu einem tropischen Sturm und bewegte sich dann west-nordwestwärts in Richtung Kleine Antillen. Während Chris sich westwärts bewegte, glaubte man zuerst, dass er sich zu einem Hurrikan verstärken und damit die Küste Floridas bedrohen könnte. Doch Chris geriet in ein Gebiet mit hoher Windscherung und löste sich am 5. August in ein breites Tiefdruckgebiet auf.
Tropischer Sturm Debby
| Tropischer Sturm | |||
|---|---|---|---|
| |||
| Dauer | 21. August – 26. August | ||
| Intensität | 45 kn (85 km/h) (1-minütig), 999 hPa | ||
Ein System vor der Küste Afrikas, welches vom NHC schon seit Tagen auf mögliche Entwicklung beobachtet wurde, wurde am 21. August zu einem tropischen Tiefdruckgebiet aufgestuft. Es wurde sofort eine tropische Sturm Warnung für die Kapverdischen Inseln herausgegeben, da man befürchtete, dass das System südlich über den Archipel ziehen könnte. Das System konnte sich aber nicht auf tropische Sturmstärke verstärken und daher wurden die Warnungen aufgehoben.
Das Tiefdrucksystem konnte sich am 22. August zu einem tropischen Sturm verstärken und wurde Debby benannt. Zuerst glaubte man, dass es sich weiter zu einem Hurrikan verstärken könnte, doch hohe Windscherung und trockene Luft verhinderten dies und das System schwächte sich am 26. August wieder zu einem tropischen Tiefdruckgebiet ab. Am selben Tag verlor es alle seine tropischen Eigenschaften und wurde extratropisch.
Hurrikan Ernesto
| Kategorie-1-Hurrikan | |||
|---|---|---|---|
| |||
| Dauer | 24. August – 1. September | ||
| Intensität | 65 kn (120 km/h) (1-minütig), 985 hPa | ||
Am 24. August bestätigte ein Aufklärungsflugzeug, dass eine tropische Welle, die die Windward Islands passierte, eine geschlossene Zirkulation entwickelt hatte, worauf diese zu einem tropischen Tiefdruckgebiet aufgestuft wurde. Am 25. August entdeckte ein weiterer Aufklärer, dass das System die Windgeschwindigkeit eines tropischen Sturm erreicht hatte, und das Tiefdruckgebiet wurde Ernesto benannt. Am 27. August erreichte Ernesto Hurrikanstärke, als er nahe an der Südspitze Haitis war, jedoch störten die hohen Berge die Zirkulation des Sturms und Ernesto wurde noch am selben Tag wieder zu einem tropischen Sturm herabgestuft.
Am 28. August ging der Sturm an der Guantánamo-Bucht an Land. Zuvor wurde prognostiziert, dass der Sturm ein starker Hurrikan im Golf von Mexiko werden könnte, just während der Gedenkfeiern für die Opfer von Hurrikan Katrina. Doch der Sturm bewegte sich deutlich weiter östlich als erwartet, was den Golf außer Gefahr brachte. Am 29. August ging er als tropischer Sturm auf der Südspitze Floridas an Land und schwächte sich in ein tropisches Tiefdruckgebiet ab. Der Sturm konnte sich jedoch schnell wieder verstärken, als er wieder über Wasser zog. Am 31. August ging er mit fast Hurrikanstärke in North Carolina an Land und wurde am nächsten Tag extratropisch.
Der Sturm tötete mindestens 8 Menschen, 3 in Haiti und 5 in den USA.
Hurrikan Florence
| Kategorie-1-Hurrikan | |||
|---|---|---|---|
| |||
| Dauer | 3. September – 12. September | ||
| Intensität | 80 kn (150 km/h) (1-minütig), 972 hPa | ||
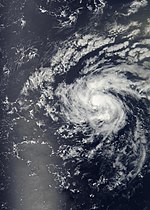
Am 3. September bildete sich zwischen Afrika und den Kleinen Antillen ein tropisches Tiefdruckgebiet. Es verstärkte sich anfangs wegen der Windscherung nur langsam, aber doch genug, um am 5. September zum tropischen Sturm Florence zu werden. Als tropischer Sturm dehnte sich Florence stark aus; tropische Sturmstärke wurde bis zu 650 km vom Zentrum erreicht. Mit seiner unorganisierten Struktur und mehreren Zentren blieb Florence mehrere Tage lang ein schwacher tropischer Sturm, auch nachdem sich die äußeren Umstände für eine Verstärkung verbessert hatten. Am Morgen des 10. September erreichte Florence Hurrikanstärke und bald in der Nähe Bermudas seine größte Stärke als Hurrikan der Kategorie 1 und wurde am 12. September, noch als Hurrikan, extratropisch.
Hurrikan Gordon
| Kategorie-3-Hurrikan | |||
|---|---|---|---|
| |||
| Dauer | 10. September – 20. September | ||
| Intensität | 105 kn (195 km/h) (1-minütig), 955 hPa | ||
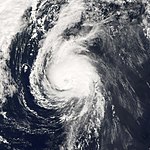
Während Florence abzog, organisierte sich ein Tiefdruckgebiet nordöstlich der Kleinen Antillen. Es entwickelte eine geschlossene Zirkulation und wurde am 10. September zu einem tropischen Tiefdruckgebiet erklärt. Nachdem es sich immer weiter verstärkte, wurde es am 11. September zum tropischen Sturm und am 12. September zum Hurrikan. Gordon erreichte den Status eines Kategorie-2-Hurrikans am 13. September und wurde noch in der gleichen Nacht auf Kategorie 3 heraufgestuft, was ihn zum ersten starken Hurrikan der Saison machte.
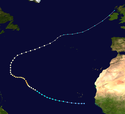
Um den 16. September herum war seine Position für einige Zeit fast unverändert ca. 1600 km östlich von Bermuda, wo er sich auf knappe Hurrikanstärke abschwächte. Während er sich anschließend ostwärts beschleunigte, verstärkte er sich allerdings wieder zur Kategorie 2. Am 19. September wurden Warnungen für die Azoren herausgegeben, weil der vorhergesagte Weg durch das Zentrum des Archipels führte. Am 20. September erreichte er die östlichen Azoren als Hurrikan der Stufe 1.
Hurrikan Helene
| Kategorie-3-Hurrikan | |||
|---|---|---|---|
| |||
| Dauer | 12. September – 24. September | ||
| Intensität | 105 kn (195 km/h) (1-minütig), 955 hPa | ||
Am 11. September verließ eine tropische Welle die Küste Westafrikas. Die Welle organisierte sich sehr schnell und konnte sich am 12. September in ein tropisches Tiefdruckgebiet entwickeln. Das System konnte sich stetig intensivieren und wurde am 13. September zum tropischer Sturm Helene aufgestuft. Das System setzte, unter guten äußeren Bedingungen, den Intensivierungstrend fort und verstärkte sich am 16. September in einen Hurrikan, um sich einen Tag später zum zweiten starken Hurrikan (Kategorie 3+) der Saison zu intensivieren. Helene bewegte sich generell in westnordwestliche Richtung, bevor es in Richtung Nordwesten hinaus auf die hohe See wegsteuerte. Helene verursachte hohe Wasserwellen bei den Bermudas, bedrohte aber zu keiner Zeit Land. Am 24. September wurde das System extratropisch.
Hurrikan Isaac
| Kategorie-1-Hurrikan | |||
|---|---|---|---|
| |||
| Dauer | 27. September – 2. Oktober | ||
| Intensität | 75 kn (140 km/h) (1-minütig), 985 hPa | ||
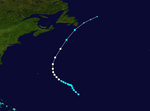
Ein Tiefdruckgebiet im Zentralatlantik produzierte zunächst einige Tage lang aktive Gewitter und wurde am 27. September zum neunten tropischen Tiefdruckgebiet der Saison hinaufgestuft. Das Tiefdruckgebiet verstärkte sich am 28. September ungefähr 1300 km ostsüdöstlich der Bermudas zu einem tropischen Sturm. Am 30. September intensivierte sich Isaac in einen Hurrikan und zog ungefähr 450 km östlich an den Bermudas vorbei, um dann in Richtung Norden auf Neufundland zuzusteuern. Am 2. Oktober wurde auf der Halbinsel von Avalon Sturmwarnung ausgegeben. Isaac zog am selben Nachmittag ungefähr 45 km an Cape Race vorbei und brachte dort Regen und Sturmböen bis 96 km/h mit sich.
Platzierung nach Accumulated Cyclone energy (ACE)
| ACE (104kt2) – | |||||||
|---|---|---|---|---|---|---|---|
| 1 | 24.3 | Helene | 6 | 2.76 | Alberto | ||
| 2 | 22.2 | Gordon | 7 | 2.31 | Debby | ||
| 3 | 9.60 | Florence | 8 | 2.30 | Beryl | ||
| 4 | 6.46 | Isaac | 9 | 2.17 | Chris | ||
| 5 | 5.72 | Ernesto | 10 | 0.645 | Unbenannt | ||
| Gesamt: 78.5 | |||||||
Die nebenstehende Tabelle zeigt den ACE für jeden Sturm dieses Jahres. Der ACE beschreibt die Energie eines tropischen Sturms, indem die Stärke eines Sturms mit der Dauer multipliziert wird, das heißt langandauernde Stürme, sowie starke Stürme haben einen hohen ACE Wert.
Jahresüberblick 2006
Weblinks
- Hurrikan Expedition: Hurricane Expedition 2006 in den USA
- NRL Monterey Marine Meteorology Division: Gute Übersicht von Hurrikanereignissen und Dokumentationen
- National Hurricane Center: Offizielle Seite der National Oceanic and Atmospheric Administration (NOAA)
Quellen
Auf dieser Seite verwendete Medien
Hurricane Wilma was a powerful Category 5 storm when the Moderate Resolution Imaging Spectroradiometer (MODIS) on NASA’s Terra satellite took this image at 12:40 p.m. Eastern Daylight Time, on October 19, 2005. Less than 24 hours before this image was taken, Wilma had rapidly grown into a record-breaking, powerful storm. Winds around the eyewall of the storm were raging at 280 kilometers per hour (175 miles per hour). Just hours before, National Oceanographic and Atmospheric Administration (NOAA) aircraft measured a record-low air pressure of 882 millibars in the center of Hurricane Wilma, making it the most intense hurricane ever observed in the Atlantic basin. Wilma also broke records for the fastest development of a storm, going from tropical storm status to Category 5 hurricane in less than 24 hours.
The high-resolution image provided above has a spatial resolution of 250 meters per pixel. The MODIS Rapid Response Team provides this image at additional resolutions.Hurricane Ernesto formed in the eastern Caribbean Sea on August 24, 2006. Within a day, it had become organized enough to be classified as a tropical storm and get named as the fifth storm of the 2006 Atlantic Season, Tropical Storm Ernesto. Ernesto built in power gradually as it moves westward and slightly north through the Caribbean Sea, just reaching hurricane strength as it neared Hispaniola (The island on which the nations of Haiti and Dominican Republic are located.) on August 27. This made it the first storm of the 2006 Atlantic season to reach hurricane strength. However, the interactions of the storm with land robbed Ernesto of enough power to sink it back to storm status again, where it is anticipated it will remain until at least after it crosses Cuba, forecast to have happened on August 28. If predictions made on August 28 hold true, the storm will travel most of the length of Cuba, then cross the Straits of Florida, possibly regaining enough power to become a hurricane again before coming ashore again in southern Florida.
This photo-like image was acquired by the Moderate Resolution Imaging Spectroradiometer (MODIS) on the Terra satellite on August 27 2006, at 11:50 a.m. local time (15:50 UTC). Hurricane Ernesto at the time of this image was a well-developed storm system, but its interactions with Hispaniola had started to distort the hurricane enough to rob it of a well-defined eye. According to the University of Hawaii’s Tropical Storm information center, Ernesto had sustained peak winds of around 110 kilometers per hour (65 miles per hour) at the time Aqua MODIS acquired these data.
The high-resolution image provided above is provided at the full MODIS spatial resolution (level of detail) of 250 meters per pixel. The MODIS Rapid Response System provides this image at additional resolutions.Tropical Storm Beryl formed in the northwestern Atlantic on July 18, 2006, roughly 200 kilometers (120 miles) southeast of North Carolina’s Outer Banks. The tropical depression gradually gathered just enough power to reach storm status and become the second named storm system of the 2006 Atlantic hurricane season. As of July 20, it had gained only slightly more strength and was headed north towards New York City. Forecasts at the time predicted that the storm would continue to travel north, but then curve away to the east before getting close to land. The storm was also not expected to become strong enough to be classified as a hurricane.
This photo-like image was acquired by the Moderate Resolution Imaging Spectroradiometer (MODIS) on the Terra satellite on July 19, 2006, at 11:15 a.m. local time (15:15 UTC). The storm had a very basic swirling shape embedded within a larger train of clouds stretching northeast. These clouds are associated with a cold front over the Atlantic Ocean. Sustained winds in the storm system were estimated to be around 95 kilometers per hour (60 miles per hour) around the time the image was captured, according to the University of Hawaii’s Tropical Storm Information Center.Tropical Storm Alberto formed as a tropical depression early in the morning on June 10, 2006, in the Yucatan Channel. Alberto gradually gathered strength as it took a slow track northward into the Gulf. By early morning on June 11, wind strength within the storm crossed the critical threshold of 39 knots (70 kilometers per hour; 45 miles per hour). Thus Alberto became the first named storm of the 2006 Atlantic hurricane season. Although Alberto briefly flirted with hurricane status as wind speeds came close to the necessary 64 knots (118 km/hr; 74 mph), the system remained a strong tropical storm as of the morning of June 13, and it was projected to weaken as it comes ashore in northern Florida.
This photo-like image was acquired by the Moderate Resolution Imaging Spectroradiometer (MODIS) on the Aqua satellite on June 12, 2006, at 2:35 p.m. local time (18:35 UTC). The tropical storm did have hints of a spiral structure, but as in earlier satellite images, the bulk of the clouds and rainfall from the storm were east of the storm’s center. This large mass of clouds in the image appears over the Florida panhandle and mainland Florida, while the wind circulation center is located roughly 200 kilometers (120 miles) to the west of Tampa.
Sustained winds in the storm system were estimated to be around 110 kilometers per hour (70 miles per hour) around the time the image was captured, according to the University of Hawaii’s Tropical Storm Information Center. However, the less-than-hurricane-strength winds did not mean that Alberto posed no significant hazards. Rainfall totals from the storm were predicted to be between 12 to 25 centimeters (5 to 10 inches), and the storm center was also expected to spawn tornadoes once Alberto crossed land. Drought-stricken Florida was looking for rain, but the heavy downpours predicted were also causing concerns about local flooding.This image of Tropical Storm Chris was captured at 1724 UTC as it passed near the northern Leeward Islands. At the time, winds were 65 mph and the pressure was 1001 mb.
From NASA: Hurricane Gordon was the seventh named storm of the 2006 Atlantic Hurricane Season. Gordon started as a tropical depression off the Leeward Islands in the Caribbean. Since forming on September 10, it had steadily grown in power and size. On September 13, 2006, it became a Category One hurricane, and it intensified further in the next day, reaching Category Three status in the following 24 hours, according to the National Hurricane Center. This made it the first major hurricane in the 2006 Atlantic hurricane season: The previous two hurricanes in 2006, Ernesto and Florence, never intensified beyond Category One strength.
This photo-like image was acquired by the Moderate Resolution Imaging Spectroradiometer (MODIS) on NASA’s Aqua satellite on September 14, 2006, at 1:10 p.m. local time (17:10 UTC). Gordon is a very large and well-defined hurricane in this image, possessing a distinct, tightly wound central portion, a strong and complete eyewall structure all the way around the eye of the storm, and an eye with only a little cloud cover (sometimes called an open, or partially open, eye). These characteristics are all hallmarks of powerful hurricanes. To the north and east of the storm, a large band of more diffuse cloud is pocked with darker spots where powerful thunderstorm systems are forcing up tall cloud towers that cast shadows onto the cloud deck below. Hurricane Gordon had sustained winds of around 185 kilometers per hour (115 miles per hour) at the time this satellite image was acquired, according to The University of Hawaii’s Tropical Storm information center.
Gordon, however, was nowhere near land and as of September 15, it was projected to weaken over cooler waters as it veered northeast in the general direction of the Azores.Hurricane Isaac became the fifth hurricane of the 2006 Atlantic Hurricane season on September 30. Beginning as a tropical depression three days earlier, Isaac formed in the central Atlantic Ocean far from any land. Isaac initially headed northeast on a track towards Bermuda, picking up power to become a hurricane. But Hurricane Isaac never posed a threat to the island, as it was veering off onto a more northerly track even as the storm became more organized and powerful. As of October 2, 2006, Isaac was heading north and slightly east in the general direction of the Canadian Maritime Provinces, but it was expected to curve off east and not come ashore in Canada either. The hurricane was losing power as it travelled north and was downgraded to a tropical storm by midday on October 2.
This photo-like image was acquired by the Moderate Resolution Imaging Spectroradiometer (MODIS) on NASA’s Terra satellite on October 1 2006, at 12:35 p.m. local time (14:35 UTC). Isaac is a small well-formed tight ball of spiralling clouds around a well-defined eye filled with clouds (a “closed” eye). According to the University of Hawaii’s Tropical Storm Information Center, Isaac had sustained winds reaching as high as 75 miles per hour (85 mph according to NHC).Track map of Tropical Storm Beryl of the 2006 Atlantic hurricane season. The points show the location of the storm at 6-hour intervals. The colour represents the storm's maximum sustained wind speeds as classified in the Saffir–Simpson scale (see below), and the shape of the data points represent the nature of the storm, according to the legend below.
Storm type
Track map of Hurricane Ernesto of the 2006 Atlantic hurricane season. The points show the location of the storm at 6-hour intervals. The colour represents the storm's maximum sustained wind speeds as classified in the Saffir–Simpson scale (see below), and the shape of the data points represent the nature of the storm, according to the legend below.
Storm type
Track map of Hurricane Gordon of the 2006 Atlantic hurricane season. The points show the location of the storm at 6-hour intervals. The colour represents the storm's maximum sustained wind speeds as classified in the Saffir–Simpson scale (see below), and the shape of the data points represent the nature of the storm, according to the legend below.
Storm type
Hurricane Florence is the sixth named storm of the 2006 Atlantic Hurricane Season. Florence started as a tropical depression north and east of the South American coast, and since forming on September 3, it has grown in power and size only very gradually. As of September 11, 2006, it had become a Category One hurricane. It was not predicted to make landfall, but it had been brushing against Bermuda, not passing directly over the island, but bringing powerful winds, rain, and strong storm-generated surf as it passed as close as 100 kilometers (60 miles) from the island, according to the Reuters news wire.
This photo-like image was acquired by the Moderate Resolution Imaging Spectroradiometer (MODIS) on the Terra satellite on September 11 2006, at 11:05 a.m. local time (15:05 UTC). Hurricane Florence at the time of this image was a large spiral open swirl spread over a wide area of the Atlantic Ocean. Florence had sustained winds of around 145 kilometers per hour (90 miles per hour) at the time this satellite image was acquired, according to The University of Hawaii’s Tropical Storm information center.
The high-resolution image provided above is provided at the full MODIS spatial resolution (level of detail) of 250 meters per pixel. The MODIS Rapid Response System provides this image at additional resolutions.Track map of Hurricane Florence of the 2006 Atlantic hurricane season. The points show the location of the storm at 6-hour intervals. The colour represents the storm's maximum sustained wind speeds as classified in the Saffir–Simpson scale (see below), and the shape of the data points represent the nature of the storm, according to the legend below.
Storm type
Unnamed Tropical Storm on July 17 at approximately 1653 UTC. This image was produced from data from NOAA-18, provided by NOAA. The storm's maximum sustained winds were near 50 mph at the time this image was taken.
Tropical Storm Debby formed near the Cape Verde Islands off the west African coast on August 21, 2006. Within a day, it had become organized enough to be classified as a tropical storm and get named as the fourth storm of the 2006 Atlantic Season, Tropical Storm Debby. As of August 24, 2006, Tropical Storm Debby was making its way through the central Atlantic and poses no immediate threat to any land areas. It is known as a Cape Verde storm because of its formation in the far eastern Atlantic near to the Cape Verde Islands.
This photo-like image was acquired by the Moderate Resolution Imaging Spectroradiometer (MODIS) on the Terra satellite on August 24 2006, at 10:35 a.m. Tropical Storm Debby at the time of this image was a small and not particularly power storm system, though it did possess a well-defined round shape and basic if loose spiral arm structure. Tropical Storm Debby had sustained winds of around 75 kilometers per hour (45 miles per hour), according to the University of Hawaii’s Tropical Storm information center.Track map of Unnamed Tropical Storm of the 2006 Atlantic hurricane season. The points show the location of the storm at 6-hour intervals. The colour represents the storm's maximum sustained wind speeds as classified in the Saffir–Simpson scale (see below), and the shape of the data points represent the nature of the storm, according to the legend below.
Storm type
Track map of Hurricane Helene of the 2006 Atlantic hurricane season. The points show the location of the storm at 6-hour intervals. The colour represents the storm's maximum sustained wind speeds as classified in the Saffir–Simpson scale (see below), and the shape of the data points represent the nature of the storm, according to the legend below.
Storm type
Track map of Tropical Storm Chris of the 2006 Atlantic hurricane season. The points show the location of the storm at 6-hour intervals. The colour represents the storm's maximum sustained wind speeds as classified in the Saffir–Simpson scale (see below), and the shape of the data points represent the nature of the storm, according to the legend below.
Storm type
The 2006 Atlantic Hurricane season had a slow start, with very few named storms in the first months of the season. But in early September, the previously hurricane-less season threw out four hurricanes in a row: Ernesto, Florence, Gordon, and Helene. A persistent ridgeline of high pressure over the U.S. east coast steered the last three of these four storms away into the North Atlantic. Hurricanes Gordon and Helene have both reached Category Three status. As of September 19, Helene was not expected to make landfall on any of the Atlantic islands, though it may pass close enough to Bermuda to bring strong storm surges. This photo-like image was acquired by the Moderate Resolution Imaging Spectroradiometer (MODIS) on NASA’s Terra satellite on September 19, 2006, at 10:15 a.m. local time (14:15 UTC). Helene is a well-defined large sprawling storm system with long spirals arms, a tightly wound central portion, distinct eyewall, and a cloud-filled eye. These are all telltale signs of a powerful hurricane. According to the University of Hawaii’s Tropical Storm Information Center, Helene had sustained winds reaching as high as 185 kilometers per hour (115 miles per hour), making it a powerful Category Three storm. As of September 19, Helene was predicted to building power slightly more as it continued to travel over warm seas and with no significant landfalls to disrupt the hurricane’s continued strength.
Track map of Tropical Storm Alberto of the 2006 Atlantic hurricane season. The points show the location of the storm at 6-hour intervals. The colour represents the storm's maximum sustained wind speeds as classified in the Saffir–Simpson scale (see below), and the shape of the data points represent the nature of the storm, according to the legend below.
Storm type
Track map of Hurricane Isaac of the 2006 Atlantic hurricane season. The points show the location of the storm at 6-hour intervals. The colour represents the storm's maximum sustained wind speeds as classified in the Saffir–Simpson scale (see below), and the shape of the data points represent the nature of the storm, according to the legend below.
Storm type
This map shows the tracks of all tropical cyclones in the 2006 Atlantic hurricane season. The points show the location of each storm at 6-hour intervals. The colour represents the storm's maximum sustained wind speeds as classified in the Saffir-Simpson Hurricane Scale (see below), and the shape of the data points represent the type of the storm.
Track map of Tropical Storm Debby of the 2006 Atlantic hurricane season. The points show the location of the storm at 6-hour intervals. The colour represents the storm's maximum sustained wind speeds as classified in the Saffir–Simpson scale (see below), and the shape of the data points represent the nature of the storm, according to the legend below.
Storm type


