Alizarinrot S
| Strukturformel | |||||||||||||||||||
|---|---|---|---|---|---|---|---|---|---|---|---|---|---|---|---|---|---|---|---|
 | |||||||||||||||||||
| Allgemeines | |||||||||||||||||||
| Name | Alizarinrot S | ||||||||||||||||||
| Andere Namen | |||||||||||||||||||
| Summenformel | C14H7NaO7S | ||||||||||||||||||
| Kurzbeschreibung | dunkelrotes Pulver[1] | ||||||||||||||||||
| Externe Identifikatoren/Datenbanken | |||||||||||||||||||
| |||||||||||||||||||
| Eigenschaften | |||||||||||||||||||
| Molare Masse | 342,25 g·mol−1 | ||||||||||||||||||
| Aggregatzustand | fest[1] | ||||||||||||||||||
| Sicherheitshinweise | |||||||||||||||||||
| |||||||||||||||||||
| Wenn nicht anders vermerkt, gelten die angegebenen Daten bei Standardbedingungen (0 °C, 1000 hPa). | |||||||||||||||||||
Alizarinrot S (auch C.I. Mordant Red 3, Alizarin Karmin, C.I 58005) ist ein Farbstoff und pH-Indikator aus der Gruppe der Alizarine.
Eigenschaften
Alizarinrot S wurde 1871 von Carl Gräbe and Carl Theodor Liebermann entwickelt.[3] Es ist ein pH-Indikator für pH 4,3–6,3 und pH 9,4–12,0.[2] Alizarinrot S wird in der Histologie und Pathologie zur histologischen Färbung von Calciumverbindungen verwendet[4][5][6] und färbt Calcium ziegelrot.[7] Die Färbung von Calcium erfolgt am besten bei pH 9.[8] Die Färbung mit Alizarinrot S ist die Standardmethode bei der mikroskopischen Quantifizierung der Mineralisierung von Osteoblasten.[9] In Verbindung mit Alcianblau wird es zur Färbung von Skeletten von Mäusen verwendet.[10]
In der Augenheilkunde wird Alizarinrot S zur Untersuchung von Verkalkungen in der Augenlinse eingesetzt.[11] In Korallen wird Alizarinrot S zur Färbung von täglichen Wachstumsschichten verwendet.[12] Ebenso wird es in der Geologie zur Färbung von Carbonaten eingesetzt.[13] Obwohl unter den Anthrachinon-Derivaten einige genotoxisch sind und in doppelsträngige DNA interkalieren, ist Alizarinrot S weder zyto- noch genotoxisch.[14]
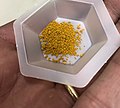 Alizarinrot S als Pulver
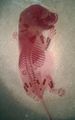 Skelettfärbung bei einer Ratte, mit Calcium-reichen Bereichen in dunkelrot
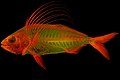 Skelettfärbung bei Nematistius pectoralis
 Zementoblasten in Zellkultur
Einzelnachweise
- ↑ a b Eintrag zu Alizarinrot S Natriumsalz in der GESTIS-Stoffdatenbank des IFA, abgerufen am 7. Februar 2025. (JavaScript erforderlich)
- ↑ a b c Carl Roth Deutschland: Alizarinrot S (C.I. 58005), 10 g, CAS No. 130-22-3, abgerufen am 7. Februar 2025.
- ↑ Lea Legan, Klara Retko, Polonca Ropret: Vibrational spectroscopic study on degradation of alizarin carmine. In: Microchemical Journal. 127. Jahrgang, 2016, S. 36–45, doi:10.1016/j.microc.2016.02.002 (englisch).
- ↑ Holde Puchtler, Susan N. Meloan, Mary S. Terry: On the history and mechanism of alizarin and alizarin red S stains for calcium. In: Journal of Histochemistry & Cytochemistry. 17. Jahrgang, Nr. 2, 1969, S. 110–124, doi:10.1177/17.2.110, PMID 4179464 (englisch).
- ↑ John Bancroft, Alan Stevens (Hrsg.): The Theory and Practice of Histological Techniques. 2nd Auflage. Longman Group Limited, 1982 (englisch).
- ↑ Ralph Dougall Lillie: H. J. Conn's Biological stains. 9th Auflage. Williams & Wilkins, Baltimore 1977, S. 692p (englisch).
- ↑ M. Lievremont, J. Potus, B. Guillou: Use of alizarin red S for histochemical staining of Ca2+ in the mouse; some parameters of the chemical reaction in vitro. In: Acta anatomica. Band 114, Nummer 3, 1982, S. 268–280, doi:10.1159/000145596, PMID 7158284.
- ↑ H. Puchtler, S. N. Meloan, M. S. Terry: On the history and mechanism of alizarin and alizarin red S stains for calcium. In: The journal of histochemistry and cytochemistry : official journal of the Histochemistry Society. Band 17, Nummer 2, Februar 1969, S. 110–124, doi:10.1177/17.2.110, PMID 4179464.
- ↑ A. Bernar, J. V. Gebetsberger, M. Bauer, W. Streif, M. Schirmer: Optimization of the Alizarin Red S Assay by Enhancing Mineralization of Osteoblasts. In: International Journal of Molecular Sciences. Band 24, Nummer 1, Dezember 2022, S. , doi:10.3390/ijms24010723, PMID 36614166, PMC 9821450 (freier Volltext).
- ↑ T. J. Mead: Alizarin Red and Alcian Blue Preparations to Visualize the Skeleton. In: Methods in molecular biology. Band 2043, 2020, S. 207–212, doi:10.1007/978-1-4939-9698-8_17, PMID 31463914.
- ↑ P. Kanclerz, T. M. Yildirim, R. Khoramnia: Microscopic Characteristics of Late Intraocular Lens Opacifications. In: Archives of pathology & laboratory medicine. Band 145, Nummer 6, Juni 2021, S. 759–767, doi:10.5858/arpa.2019-0626-RA, PMID 33091924.
- ↑ Michael Holcomb, Anne L. Cohen, Daniel C. McCorkle: An evaluation of staining techniques for marking daily growth in scleractinian corals. In: Journal of Experimental Marine Biology and Ecology. 440. Jahrgang, 2013, S. 126–131, doi:10.1016/j.jembe.2012.12.003 (englisch, mblwhoilibrary.org [PDF]).
- ↑ J. A. D. Dickson: Carbonate identification and genesis as revealed by staining. In: Journal of Sedimentary Research. 36. Jahrgang, Nr. 4, 1966, S. 491–505, doi:10.1306/74D714F6-2B21-11D7-8648000102C1865D (englisch).
- ↑ B. Bauer, H. Rossi, H. Hintzsche: Genotoxicity testing of the anthraquinone dye Alizarin Red S. In: Current research in toxicology. Band 8, 2025, S. 100208, doi:10.1016/j.crtox.2024.100208, PMID 39811826, PMC 1173128 (freier Volltext).
Auf dieser Seite verwendete Medien
Autor/Urheber: NadirSH, Lizenz: CC BY-SA 4.0
chemische Struktur von Alizarin Rot S

Autor/Urheber: Waughd, Lizenz: CC BY-SA 4.0
Alizarin Red S powder, also known as C.I. Mordant Red 3, Alizarin Carmine, and C.I 58005

Autor/Urheber: M. Girard - University of Kansas, Lizenz: CC BY-SA 4.0
Red alizarin stained juvenile Roosterfish (Nematistius pectoralis) light by florescent light

Autor/Urheber: Прокопюк Владимир Юрьевич, Lizenz: CC BY-SA 4.0
Red alizarin staining of rat`s embrionic bones for osteogenesis study

Autor/Urheber: Bhargava, S.; Jankowski, J.; Merckelbach, E.; Roth, C.E.; Craveiro, R.B.; Wolf, M., Lizenz: CC BY 4.0
Figure 5. Visualization and quantification of cementoblast calcification via alizarin red staining. Cementoblasts were incubated for 7 days with 6 different calcification conditions: the first, 1.9 mmol L−1 of phosphate, the second, 2.5 mmol L−1 calcium, the third, 1.3 mmol L−1 phosphate and 0.2 mmol L−1 calcium added to DMEM containing 2.5% FCS. The fourth condition was 75 µmol L−1 ascorbic acid, 10 mmol L−1 β-glycerolphosphate, and 10 nmol L−1 dexamethasone, the fifth, 75 µmol L−1 ascorbic acid, 12.5 mmol L−1 β-glycerolphosphate, and 5 nmol L−1 dexamethasone and the sixth, 75 µmol L−1 ascorbic acid, 7.5 mmol L−1 β-glycerolphosphate, and 5 nmol L−1 dexamethasone added to DMEM containing 5% FCS. The cells were stained by alizarin red staining and imaged. Shown are the representative images of alizarin red staining from conditions 1–3 (A) and conditions 4–6 (C), and the quantification of the percentage of stained area of condition 1–3 (B) and condition 4–6 (D). Data are shown as means ± SEM (n = 9). *** p ≤ 0.001 and **** p ≤ 0.0001 compared with the control based on one-way ANOVA. Bonferroni’s multiple comparisons were used as a post-test.