Pluto's Sputnik Planum geologic map (cropped)
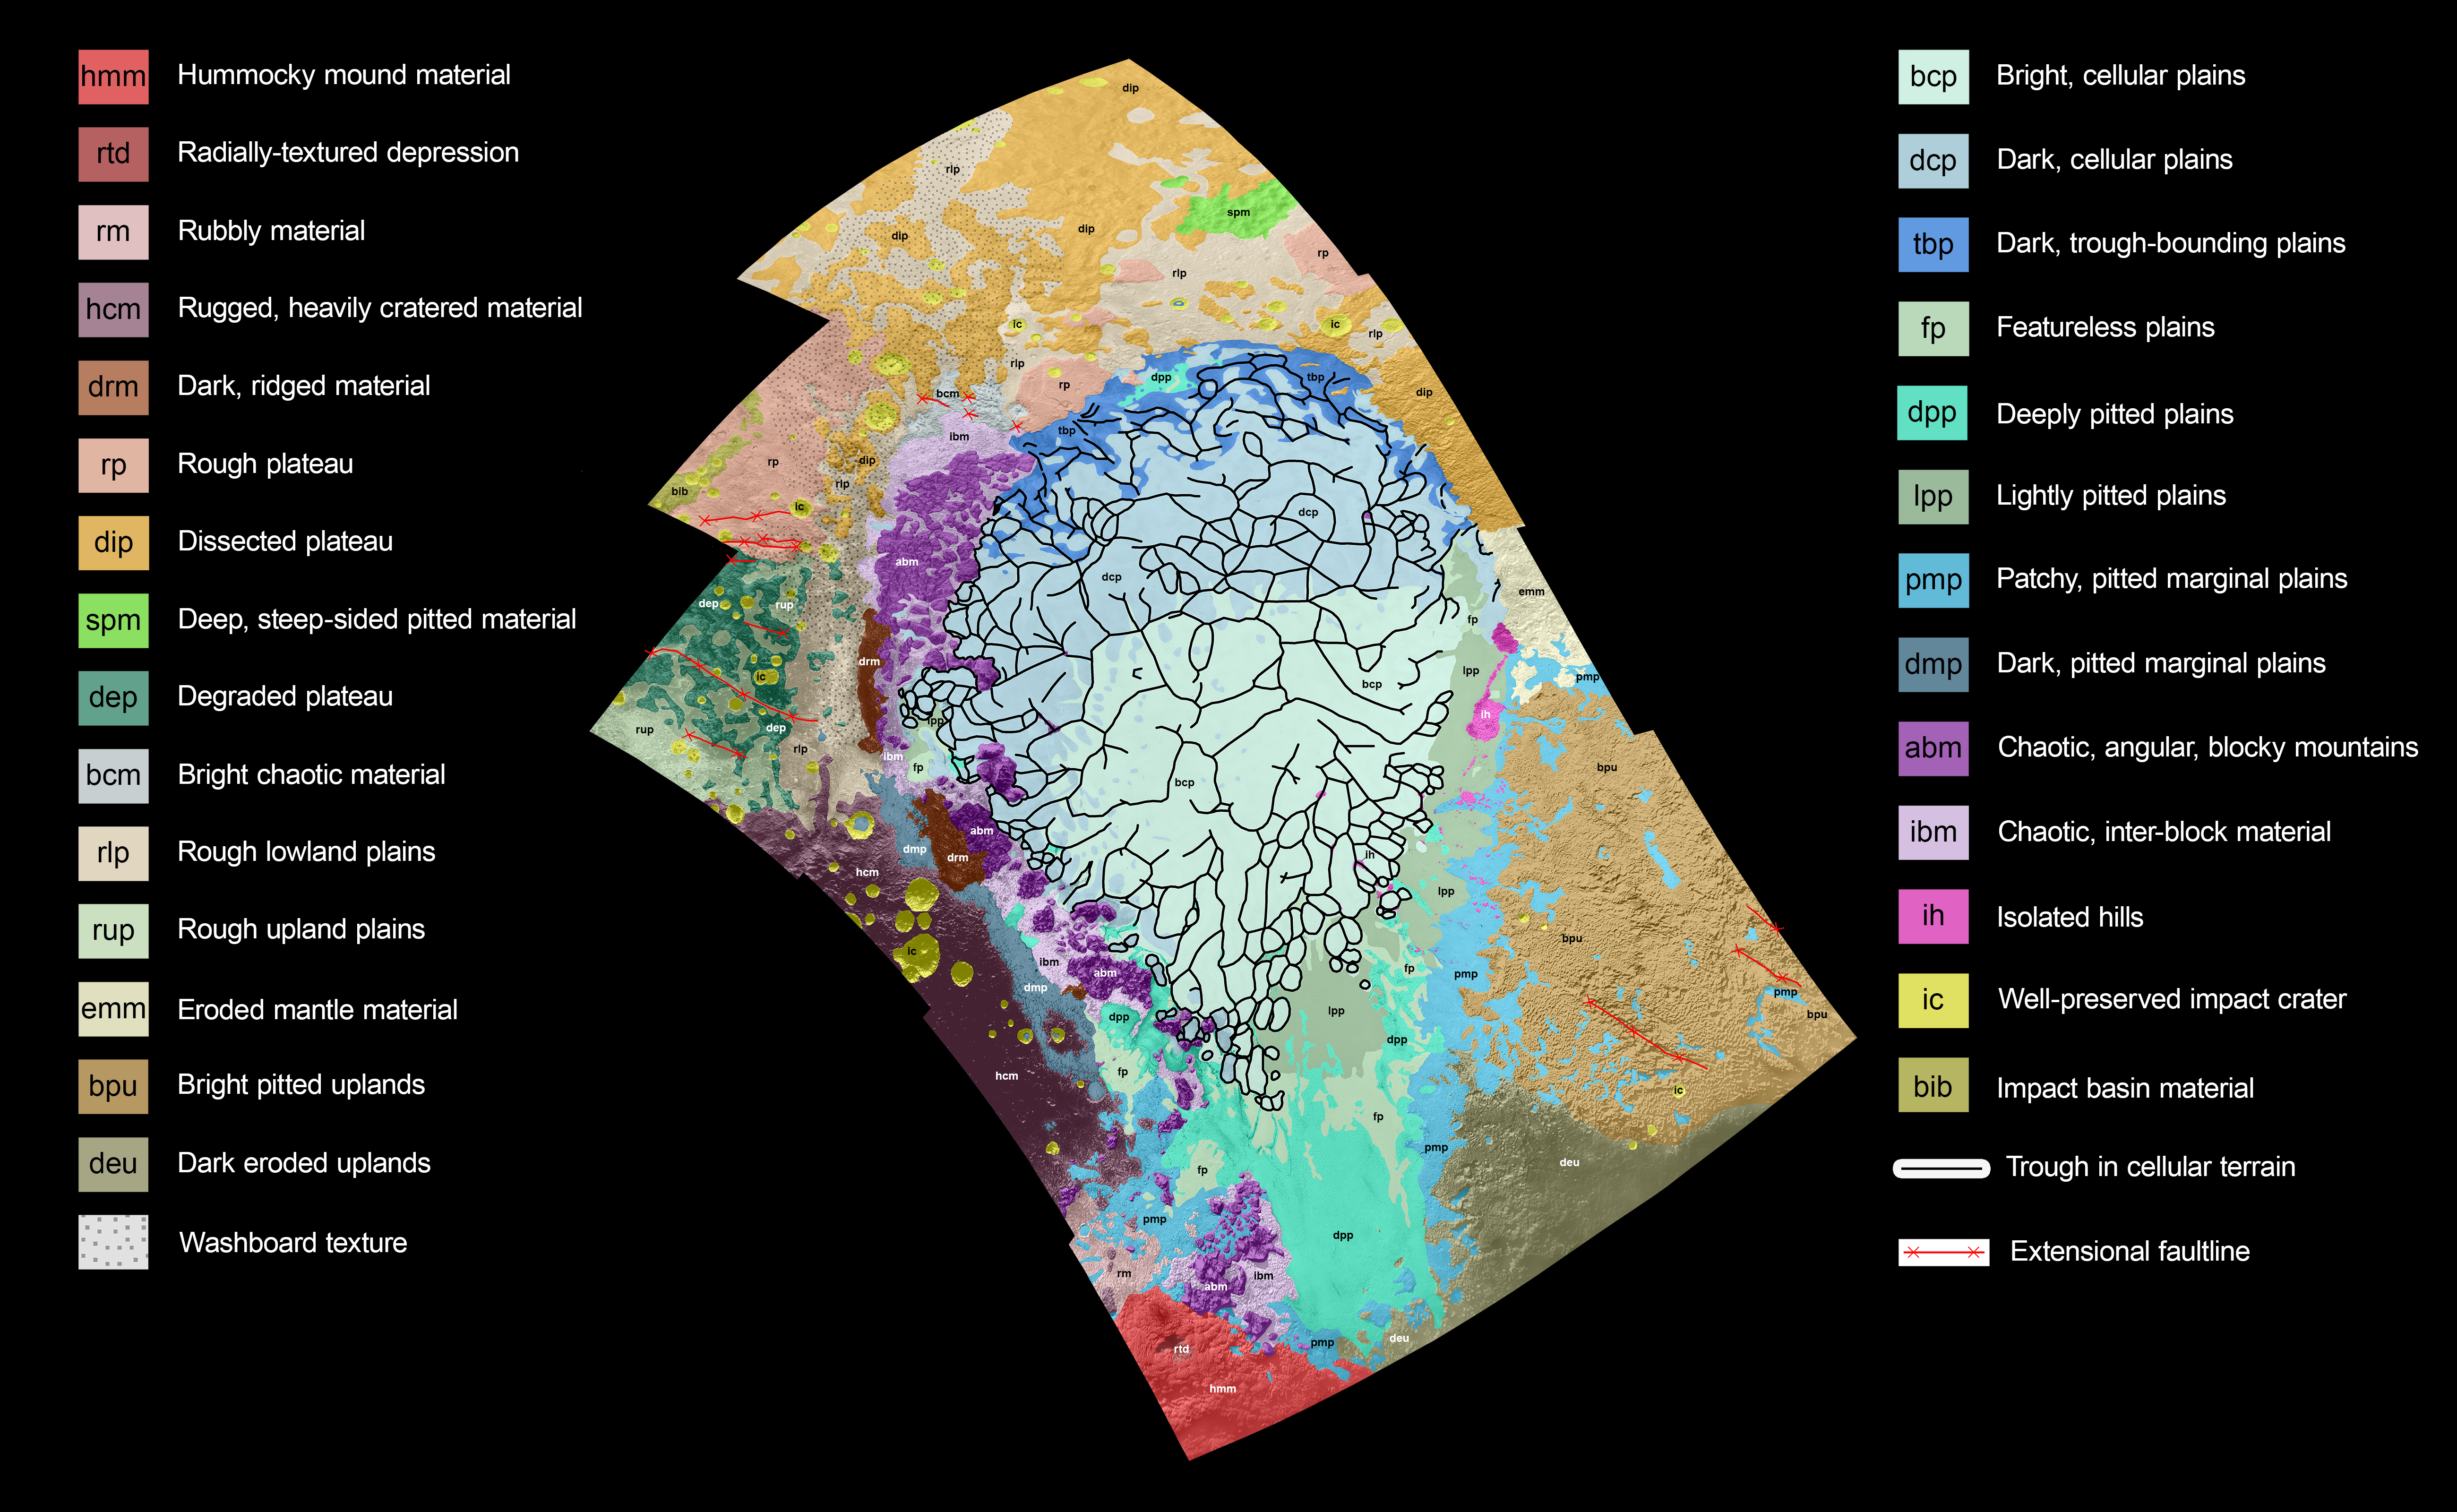
This map covers a portion of Pluto’s surface that measures 1,290 miles (2,070 kilometers) from top to bottom, and includes the vast nitrogen-ice plain informally named Sputnik Planum and surrounding terrain. As the key in the figure below indicates, the map is overlaid with colors that represent different geological terrains. Each terrain, or unit, is defined by its texture and morphology – smooth, pitted, craggy, hummocky or ridged, for example. How well a unit can be defined depends on the resolution of the images that cover it. All of the terrain in this map has been imaged at a resolution of approximately 1,050 feet (320 meters) per pixel or better, meaning scientists can map units with relative confidence
The various blue and greenish units that fill the center of the map represent different textures seen across Sputnik Planum, from the cellular terrain in the center and north, to the smooth and pitted plains in the south. The black lines represent troughs that mark the boundaries of cellular regions in the nitrogen ice. The purple unit represents the chaotic, blocky mountain ranges that line Sputnik’s western border, and the pink unit represents the scattered, floating hills at its eastern edge. The possible cryovolcanic feature informally named Wright Mons is mapped in red in the southern corner of the map. The rugged highlands of the informally named Cthulhu Regio are mapped in dark brown along the western edge, pockmarked by many large impact craters, shown in yellow.
By studying how the boundaries between units crosscut one another, mission scientists can determine which units overlie others, and assemble a relative chronology for the different units. For example, the yellow craters (at left, on the western edge of the map) must have formed after their surrounding terrain. Producing such maps is important for gauging what processes have operated where on Pluto, and when they occurred relative to other processes at work.
The base map for this geologic map is a mosaic of 12 images obtained by the Long Range Reconnaissance Imager (LORRI) at a resolution of 1,280 feet (about 390 meters) per pixel. The mosaic was obtained at a range of approximately 48,000 miles (77,300 kilometers) from Pluto, about an hour and 40 minutes before New Horizons' closest approach on July 14, 2015.
(Last Updated: Feb. 11, 2016 - Editor: Tricia Talbert)
The original NASA image has been cropped by the uploader.


Relevante Bilder


.jpg)


.jpg)


.jpg)


.jpg?uselang=de)
Relevante Artikel
PlutoPluto ist der größte und zweitmassivste bekannte Zwergplanet des Sonnensystems und das am längsten bekannte Objekt des Kuipergürtels. Er bewegt sich auf einer noch exzentrischeren Bahn um die Sonne als der Planet Merkur. Sein Volumen entspricht etwa einem Drittel des Erdmondes. .. weiterlesen