Katia 2011 track
Autor/Urheber:
Shortlink:
Quelle:
Größe:
2700 x 2027 Pixel (2695008 Bytes)
Beschreibung:
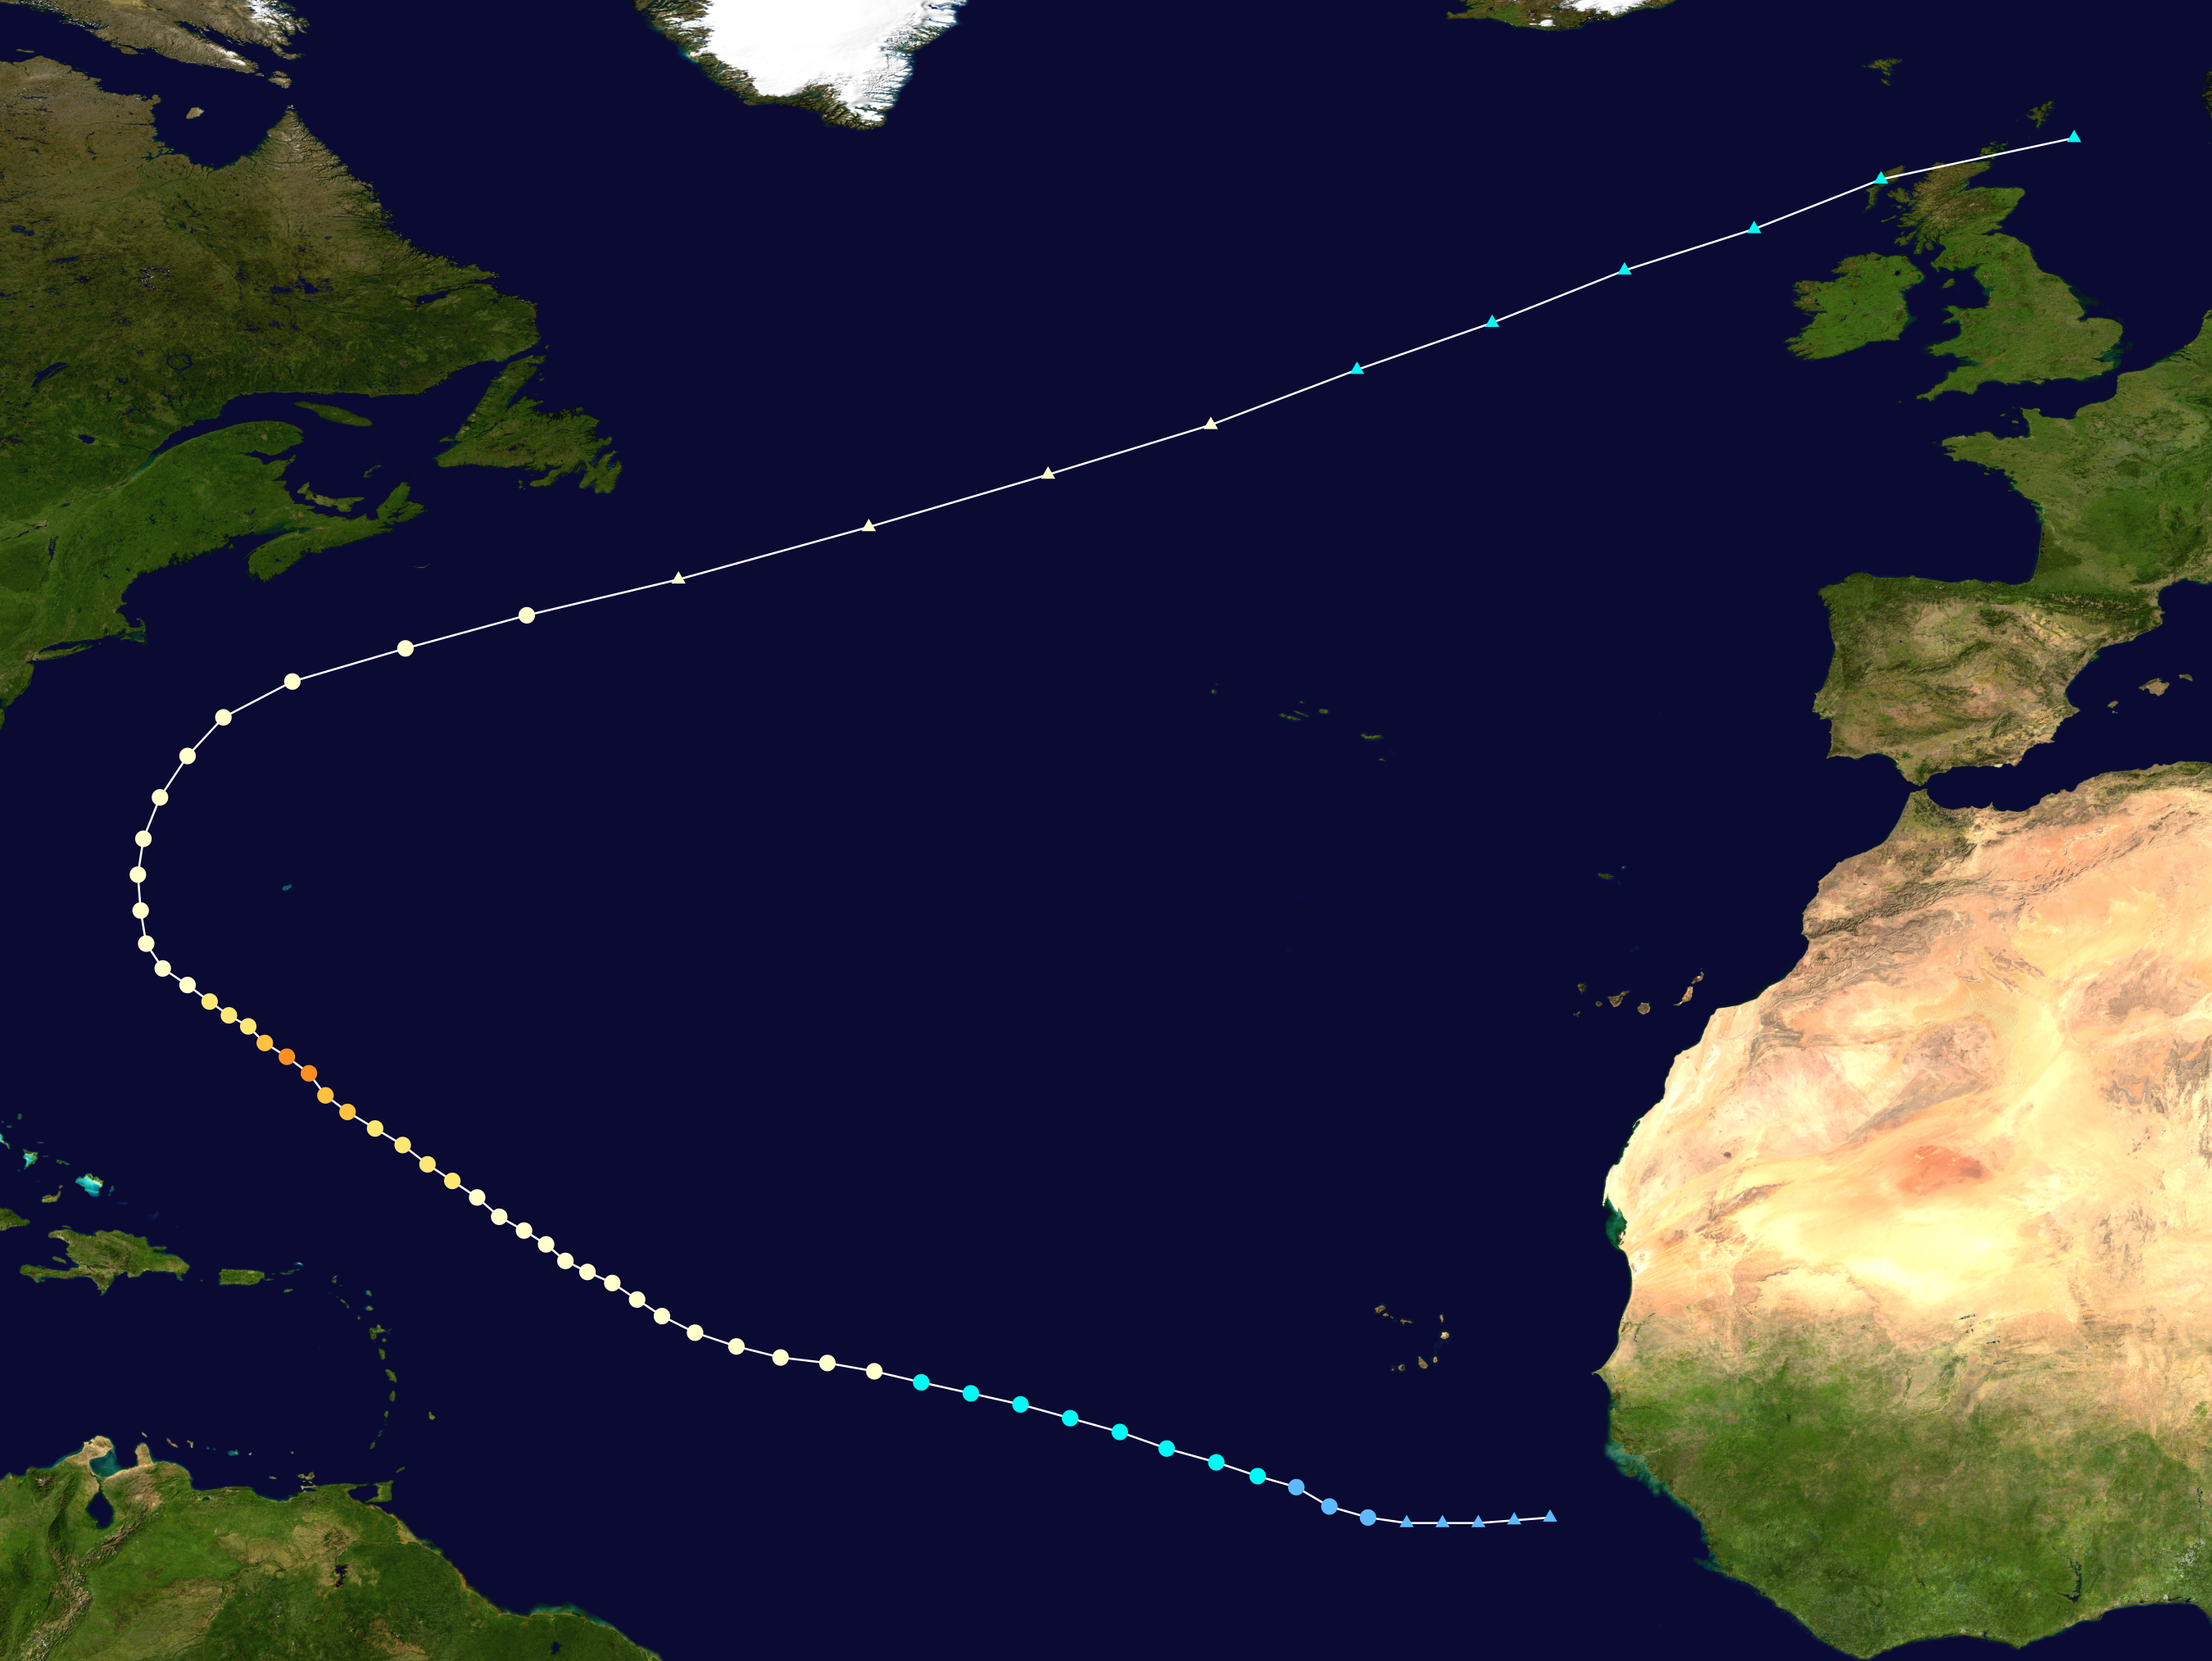
Track map of Hurricane Katia of the 2011 Atlantic hurricane season. The points show the location of the storm at 6-hour intervals. The colour represents the storm's maximum sustained wind speeds as classified in the (see below), and the shape of the data points represent the nature of the storm, according to the legend below.
 Extratropical cyclone / Remnant low / Tropical disturbance / Monsoon depression
Tropical depression (≤38 mph, ≤62 km/h)
Tropical storm (39–73 mph, 63–118 km/h)
Category 1 (74–95 mph, 119–153 km/h)
Category 2 (96–110 mph, 154–177 km/h)
Category 3 (111–129 mph, 178–208 km/h)
Category 4 (130–156 mph, 209–251 km/h)
Category 5 (≥157 mph, ≥252 km/h)
Unknown
Storm type
Lizenz:
Public domain
Credit:
Created by Cyclonebiskit using Wikipedia:WikiProject Tropical cyclones/Tracks. The background image is from NASA. Tracking data is from the National Hurricane Center[1].
Bild teilen:


Relevante Bilder


_Jul_21_2011.jpg)


Relevante Artikel
Atlantische Hurrikansaison 2011Die Atlantische Hurrikansaison 2011 begann offiziell am 1. Juni und endete am 30. November. Während dieser Periode bilden sich die meisten tropischen Stürme, da nur zu dieser Zeit geeignete Bedingungen, wie etwa ein warmer Ozean, feuchte Luft und wenig Windscherung, existieren, um die Bildung von Tropischen Wirbelstürmen zu ermöglichen. .. weiterlesen
NordatlantiktiefNordatlantiktief, oft auch nur kurz Atlantiktief, nennt man die Tiefdruckgebiete im Nordatlantik. .. weiterlesen